 Food Court
Use the Food Court solution to create food art. Pictures of food can be designed using libraries of food images, fruit art and pictures of vegetables.
HelpDesk
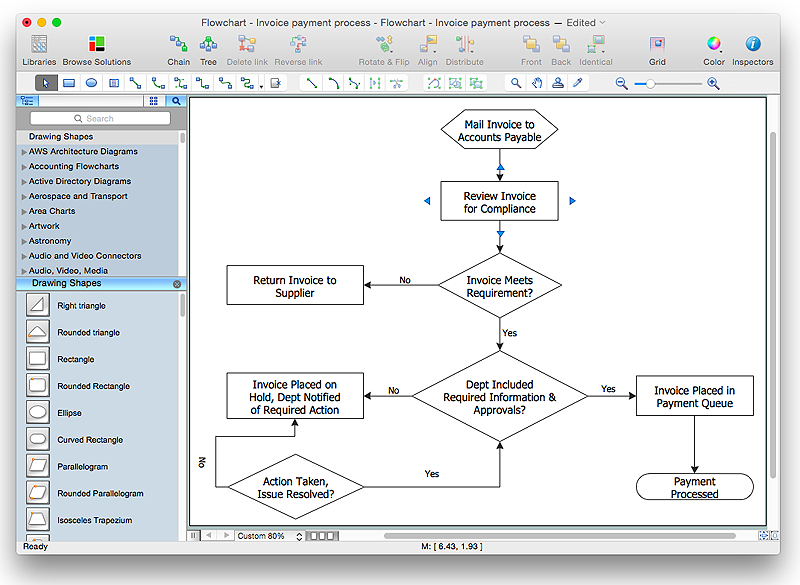
How to Simplify Flow Charting in ConceptDraw PRO on OS X
Flowchart is a great way to present any complex process in a simple to understand manner. Flowchart is perhaps the most common form of diagrams used in both technical and social fields. Since a flow chart is a method that allows to describe visually any consequent process, it can be used to show the flow of logic of any process. In ConceptDraw PRO it really is simple to draw even the most complex flowcharts. Use the RapidDraw technology for the best results.HelpDesk
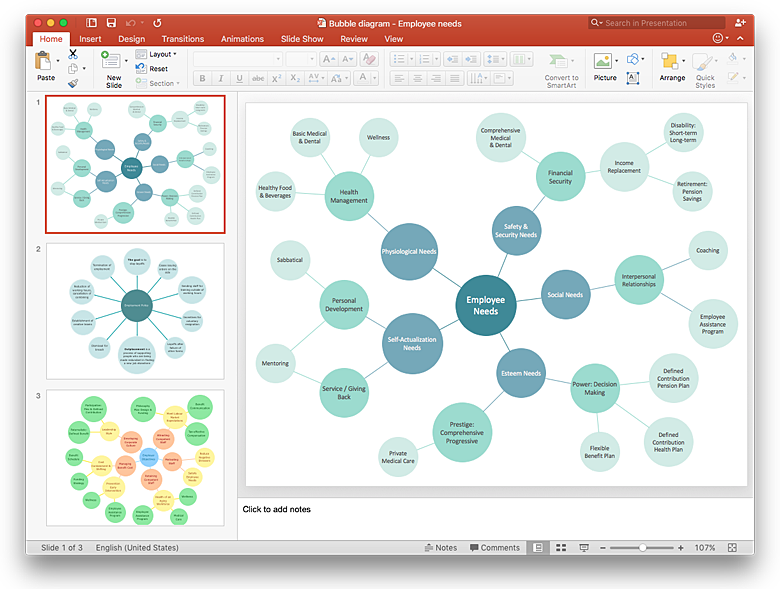
How to Add a Bubble Diagram to a PowerPoint Presentation Using ConceptDraw PRO
Bubble diagrams can be used to compare concepts, and identify areas of similarity and difference. ConceptDraw PRO allows you to make a MS PowerPoint Presentation from your charts in a few simple steps. A bubble diagram is a chart that represents information visually in the form of series of bubbles. Bubble charts are often used in marketing and management during the early stages of product development to visualize ideas and concepts by organizing them in a hierarchy. The ability to create this form of diagram is contained within the Bubble Diagrams solution. A PowerPoint presentation of bubble diagrams can be used to demonstrate and identify areas of similarity and difference of featured business ideas and concepts.HelpDesk
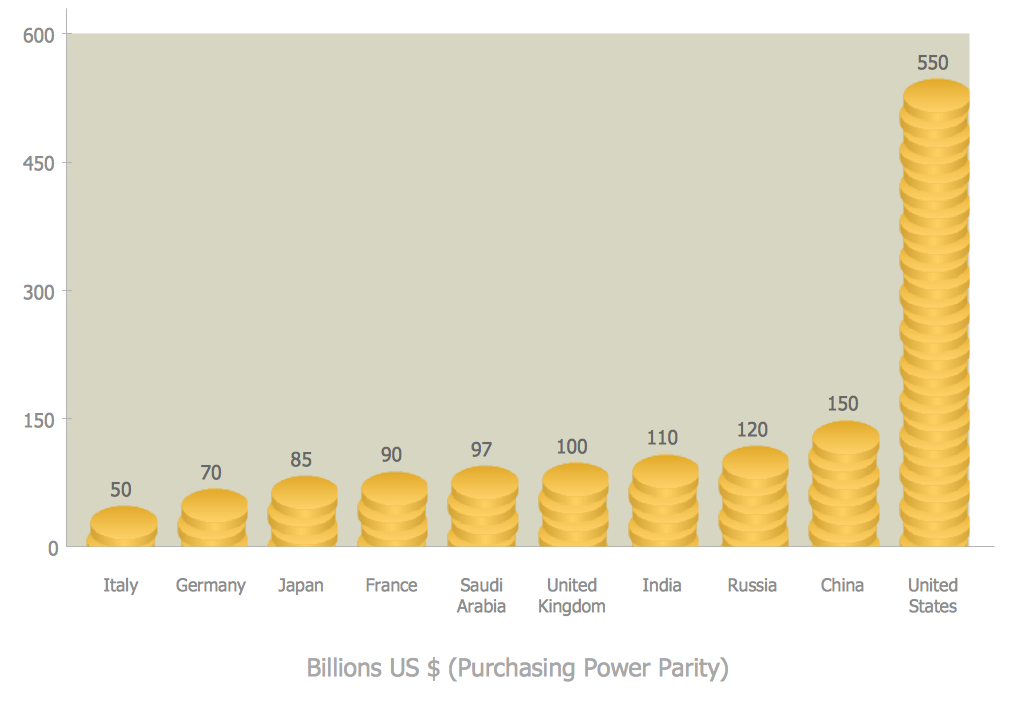
How to Create a Picture Graph in ConceptDraw PRO
Picture Graphs are used commonly to represent non-complex data to a large audience. A Picture Graph is simple kind of marketing diagram used to show the relationship among various quantities. It include pictures or symbols to represent information visually. There are many cases when you have just some numbers to show and compare. This is not a reason to not use visual tools. You can produce a simple picture graph using memorable symbols to get the best visual presentation. Using specific symbols instead of regular colored bars makes picture graphs a much more descriptive tool. You can use tools from an existing library or find appropriate clipart in ConceptDraw’s collection. ConceptDraw PRO allows you to draw a simple and easy to understand Graph Charts using the special library.HelpDesk
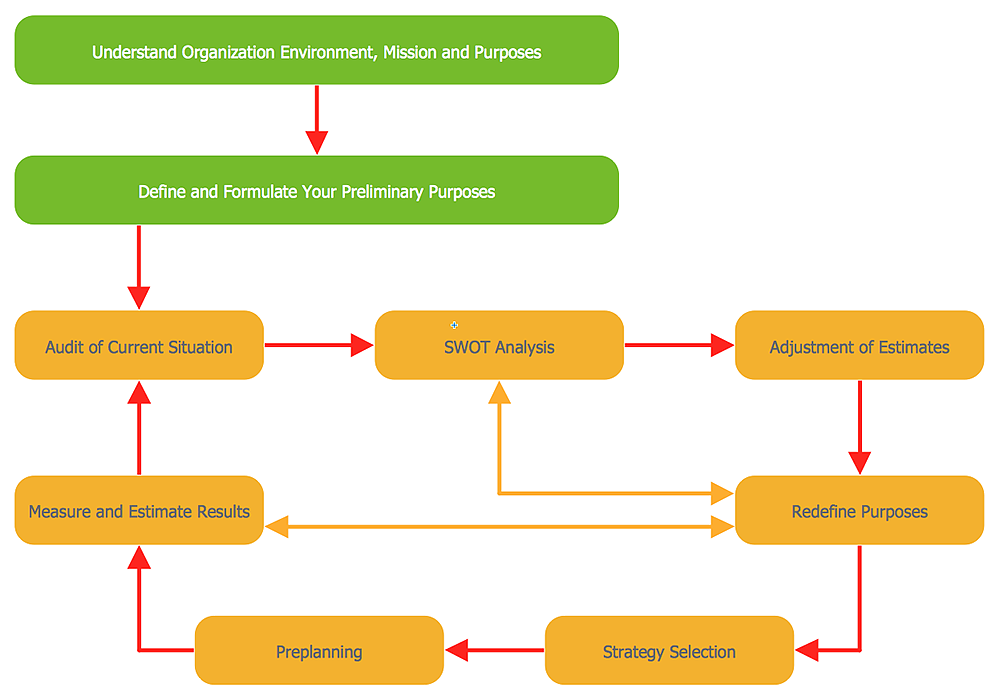
How to Add a Block Diagram to a PowerPoint Presentation Using ConceptDraw PRO
Block diagram is rather universal type of charts - compositions from geometric blocks can be applied to describe various kinds of processes or systems, consisting from components, which depend on each other. Block diagrams are indispensable when you need to represent a process or system on a basic level. With blocks, you can easily depict the basic elements of the process, without drilling down. The PowerPoint presentation of major process steps and key process participants can be very informative and helpful. Using ConceptDraw PRO, you can easily convert a block diagram to MS PowerPoint presentation.HelpDesk
How to Start Drawing a Diagram on Mac
There are many types of diagrams, you can create using Conceptdraw PRO: network diagrams, organizational charts, flow charts, workflow diagrams, technical schemes and building plans. However, there are the same basic steps to start creating almost all of them. Here tutorial we will show how to create a simple chart using a template, and how to add shapes to your drawing using libraries.
In this tutorial we will explain how to create a simple chart in ConceptDraw PRO using a template, and how to use the library objects.
 macOS User Interface
macOS User Interface solution extends the ConceptDraw PRO functionality with powerful GUI software graphic design features and tools. It provides an extensive range of multifarious macOS Sierra user interface design examples, samples and templates, and wide variety of libraries, containing a lot of pre-designed vector objects of Mac Apps icons, buttons, dialogs, menu bars, indicators, pointers, controls, toolbars, menus, and other elements for fast and simple designing high standard user interfaces of any complexity for new macOS Sierra.
HelpDesk
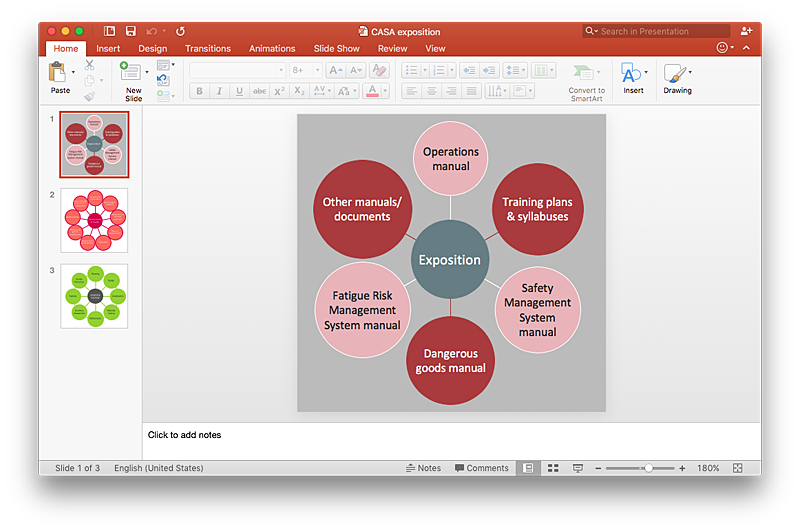
How to Add a Circle-spoke Diagram to a PowerPoint Presentation Using ConceptDraw PRO
ConceptDraw PRO can be used as a tool for creating circle spoke diagrams along with other marketing diagrams. ConceptDraw PRO allows you to make a MS PowerPoint Presentation from your marketing diagrams in a few simple steps.HelpDesk
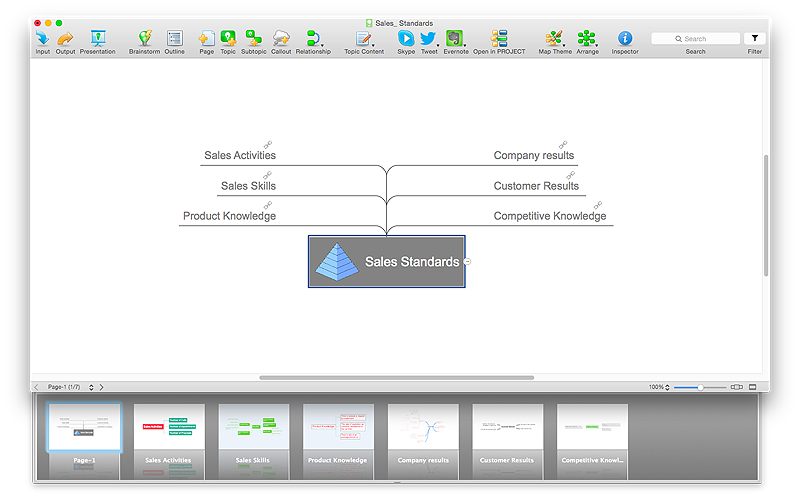
How to Split a Complex Map to a Few Simple Maps
When using ConceptDraw MINDMAP, you can move each main topic of a large complex mind map to a separate page. Here is the instructions on how to create a multiple page mind map from a solid map.- Simple Menu Samples
- Simple Fast Food Menu Style
- Picture Charts On The Samples Of Food Menu
- Simple Restaurant Menu Design
- Restaurant Floor Plans Samples | Restaurant plan | Quick Recipes ...
- Fast food restaurant menu prices | Restaurant Floor Plans Samples ...
- Simple & Fast Diagram Software | Pyramid Diagram | How to Design ...
- Simple Infographics About Restaurant
- Simple Fast Food
- Images Of Simple Art Drawing Of Healthy Food
- How to Design a Fast-Food Restaurant Menu Using ConceptDraw ...
- Online Flow Chart | Flowchart Examples | How to Design a Fast ...
- Mini Hotel Floor Plan. Floor Plan Examples | Hotel Floorplan | Hotel ...
- Interactive Voice Response Diagrams | IVR time auto-attendant ...
- IVR time auto-attendant diagram
- Flowchart Examples | Flowchart Examples and Templates ...
- How To Create Restaurant Floor Plan in Minutes | Restaurant Floor ...
- Simple Hotel Lobby Floor Plan
- How To use Building Plan Examples | Restaurant Floor Plans ...
- IVR time auto-attendant diagram | Interactive Voice Response ...
- ERD | Entity Relationship Diagrams, ERD Software for Mac and Win
- Flowchart | Basic Flowchart Symbols and Meaning
- Flowchart | Flowchart Design - Symbols, Shapes, Stencils and Icons
- Flowchart | Flow Chart Symbols
- Electrical | Electrical Drawing - Wiring and Circuits Schematics
- Flowchart | Common Flowchart Symbols
- Flowchart | Common Flowchart Symbols
