This site uses cookies. By continuing to browse the ConceptDraw site you are agreeing to our Use of Site Cookies.

How to Draw a Line Graph

In your work activity you need regularly draw the line graphs? And each time you ask yourself a question "How to Draw a Line Graph easier and faster?". The desire to automate the line graphs drawing process led to the creation of Line Graphs solution from Graphs and Charts area of ConceptDraw Solution Park.

Simple Drawing Applications for Mac

ConceptDraw gives the ability to draw simple diagrams like flowcharts, block diagrams, bar charts, histograms, pie charts, divided bar diagrams, line graphs, area charts, scatter plots, circular arrows diagrams, Venn diagrams, bubble diagrams, concept maps, and others.

Basic Diagramming

Create flowcharts, organizational charts, bar charts, line graphs, and more with ConceptDraw DIAGRAM.

Line Graph Charting Software

To design line and scatter charts use ConceptDraw DIAGRAM diagramming and vector drawing software extended with Line Graphs solution from Graphs and Charts area of ConceptDraw DIAGRAM Solution Park. (Line chart, scatter chart, 2d chart).

Simple Diagramming

Create flowcharts, org charts, floor plans, business diagrams and more with ConceptDraw DIAGRAM.

Line Chart Examples

The Line Graphs solution from Graphs and Charts area of ConceptDraw Solution Park contains a set of examples, templates and design elements library of line and scatter charts. Use it to draw line and scatter graphs using ConceptDraw DIAGRAM diagramming and vector drawing software for illustrating your documents, presentations and websites.

Process Flowchart

ConceptDraw is Professional business process mapping software for making process flow diagram, workflow diagram, general flowcharts and technical illustrations for business documents. It is includes rich examples, templates, process flowchart symbols. ConceptDraw flowchart maker allows you to easier create a process flowchart. Use a variety of drawing tools, smart connectors, flowchart symbols and shape libraries to create flowcharts of complex processes, process flow diagrams, procedures and information exchange.
How To Create a Process Flow Chart (business process modelling techniques)

ERD Symbols and Meanings

Crow's foot notation is used in Barker's Notation, Structured Systems Analysis and Design Method (SSADM) and information engineering. Crow's foot diagrams represent entities as boxes, and relationships as lines between the boxes. Different shapes at the ends of these lines represent the cardinality of the relationship.
The Chen's ERD notation is still used and is considered to present a more detailed way of representing entities and relationships.
To create an ERD, software engineers mainly turn to dedicated drawing software, which contain the full notation resources for their specific database design - ERD symbols and meanings. CS Odessa has released an all-inclusive Entity-Relationship Diagram (ERD) solution for their powerful drawing program, ConceptDraw DIAGRAM.
How to Build an Entity Relationship Diagram (ERD)

Simple & Fast Diagram Software

It is so simple making the drawing process easier and faster. you just need to choose the right drawing software.

ConceptDraw Arrows10 Technology - This is so easy and fast to draw any type of diagram with any degree of complexity.

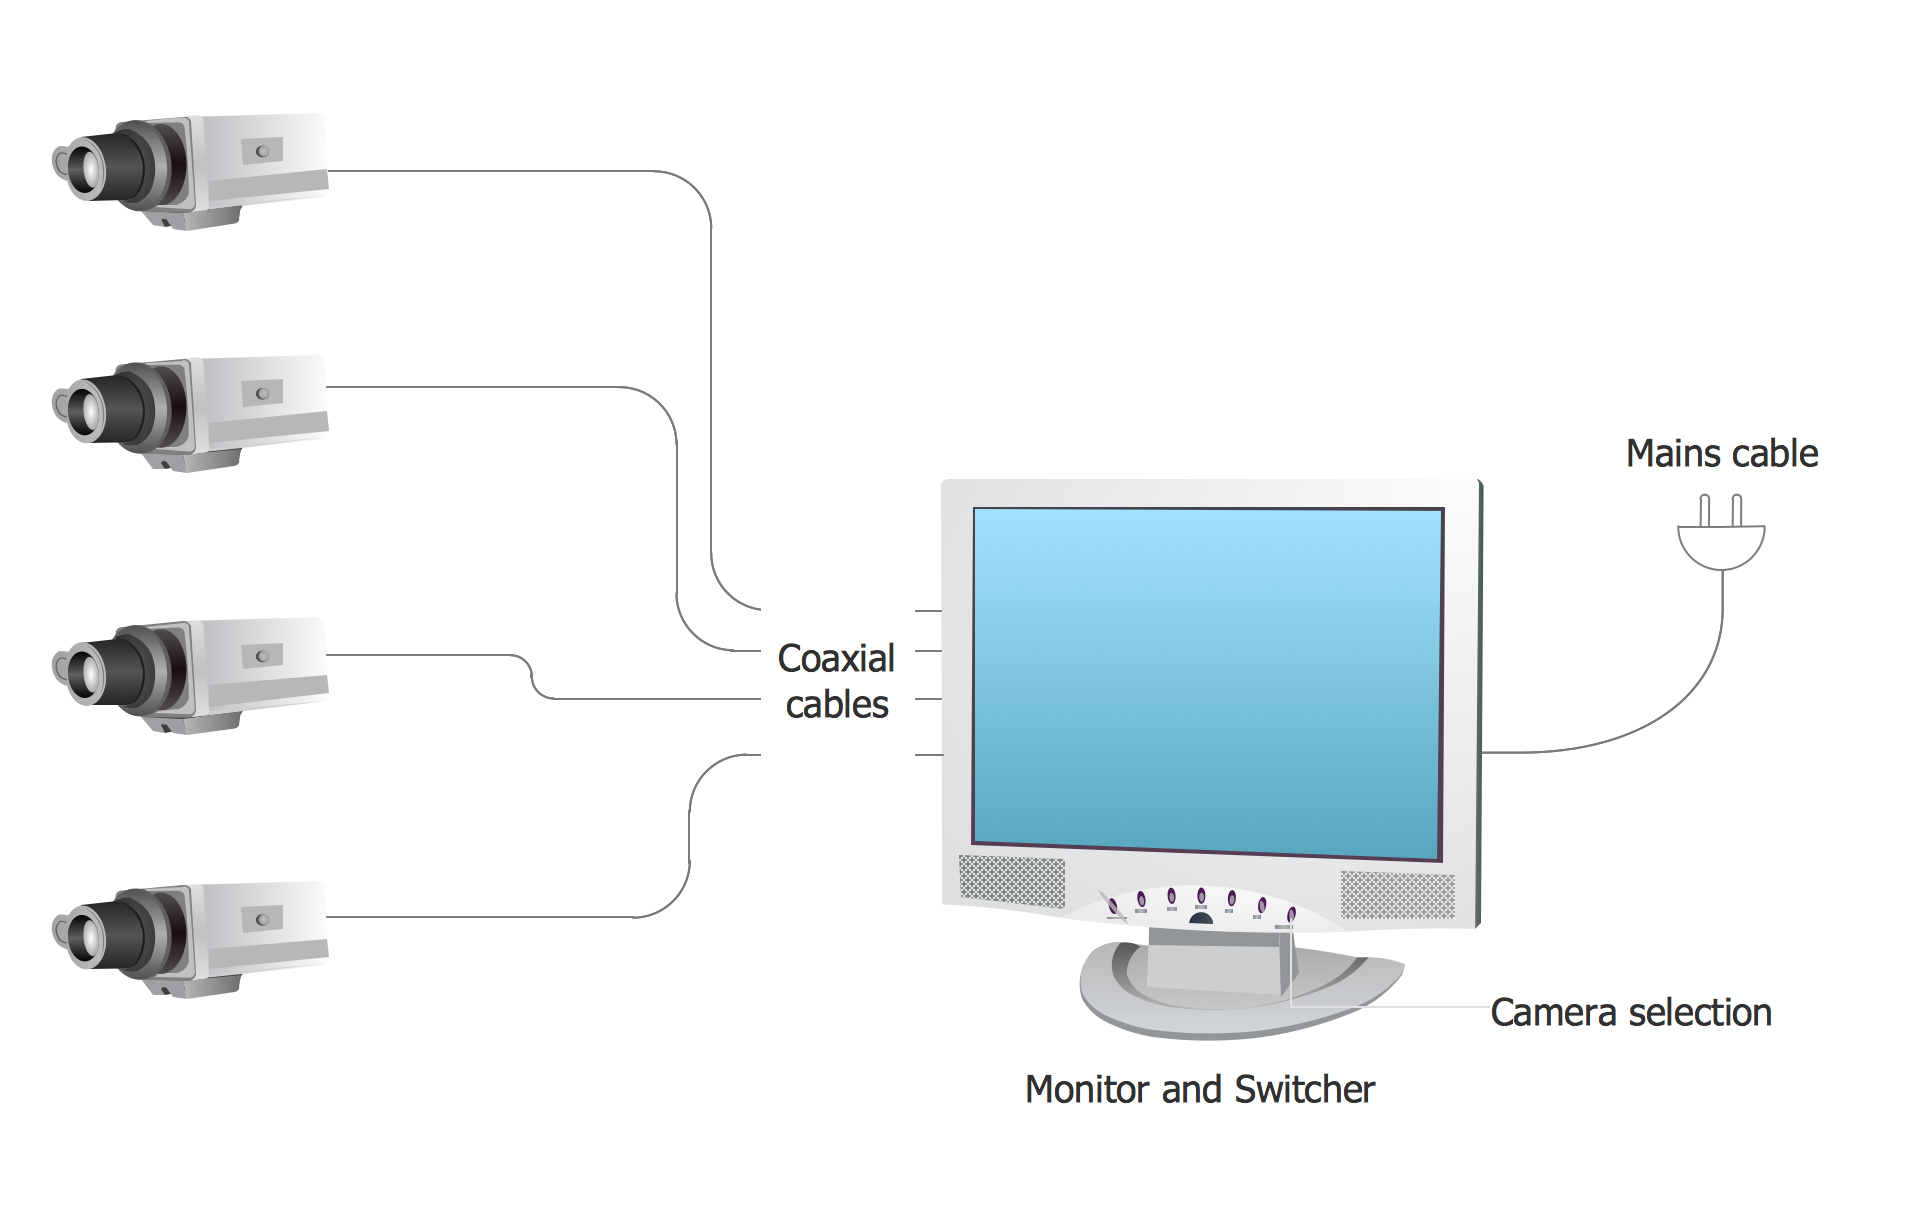
Basic CCTV System Diagram. CCTV Network Diagram Example

ConceptDraw DIAGRAM enhanced with Audio, Video, Media solution is a helpful tool for illustration of a CCTV network. It contains library of vector cliparts of video and TV devices and different digital gadgets for drawing such illustrations