Flowchart Definition
Flowchart definition - A Flowchart is a graphically representation of the structure of process or system, algorithm or the step-by-step solution of the problem. The Flowchart describes the flow of data through an information processing systems and the parts of the flows. The flow is a set of the logic operations that meet the certain requirements.Booch OOD Diagram
The vector stencils library Booch OOD from the solution Software Engineering contains specific symbols of the Booch method such as class symbols, association symbols, aggregation symbols for ConceptDraw PRO diagramming and vector drawing software. The Software Engineering solution is contained in the Software Development area of ConceptDraw Solution Park.UML State Machine Diagram.Design Elements
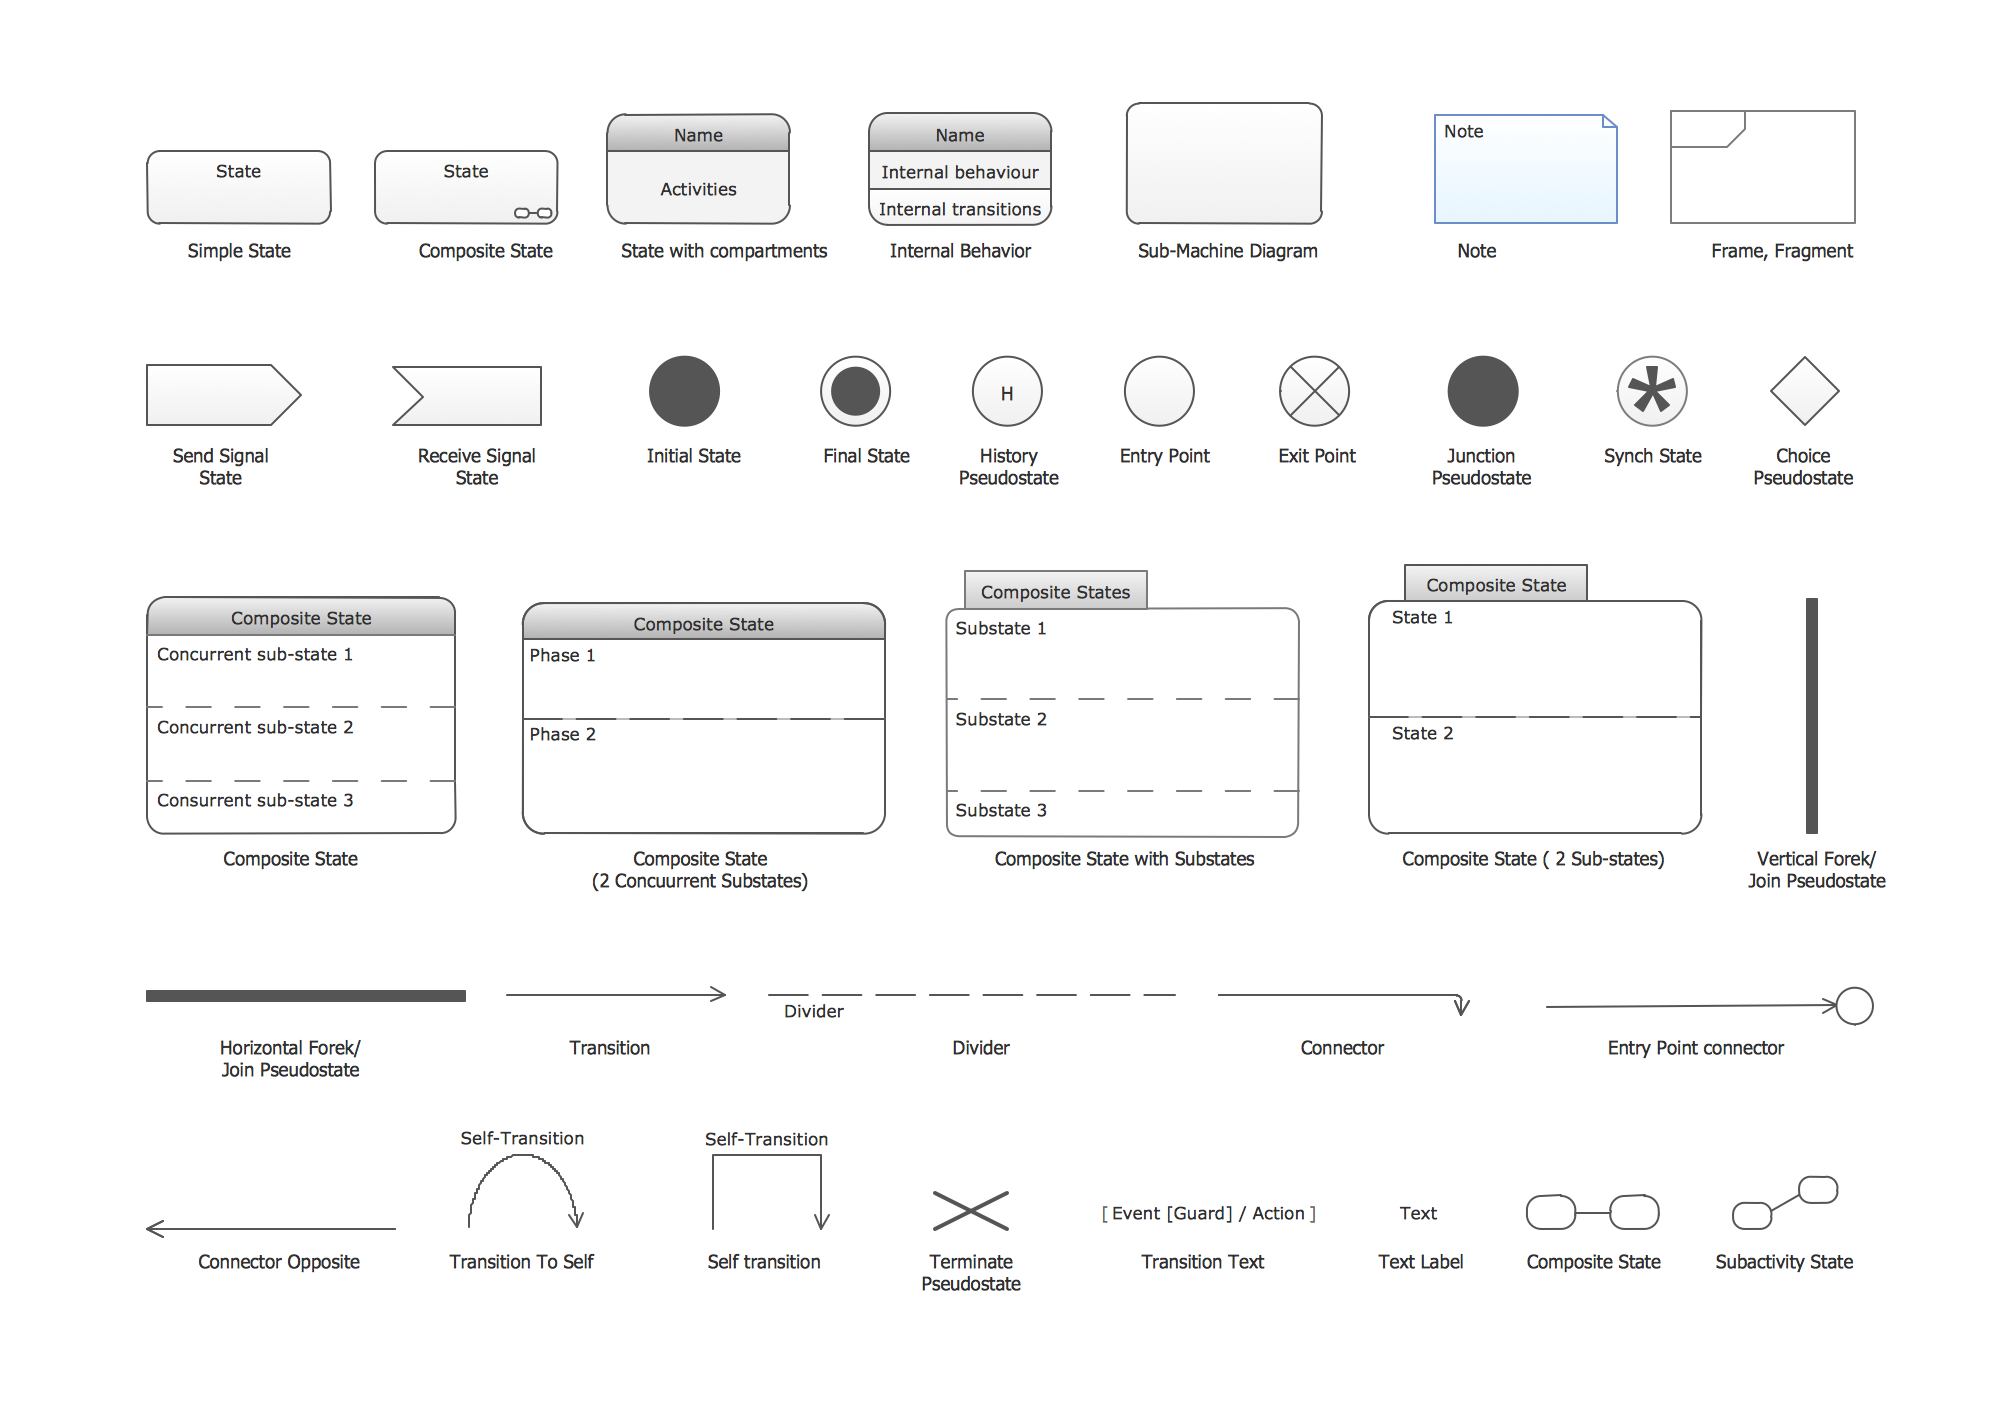
UML state machine's goal is to overcome the main limitations of traditional finite-state machines while retaining their main benefits.ConceptDraw has 393 vector stencils in the 13 libraries that helps you to start using software for designing your own UML Diagrams. You can use the appropriate stencils of UML notation from UML State Machine library.
UML Sequence Diagram. Design Elements
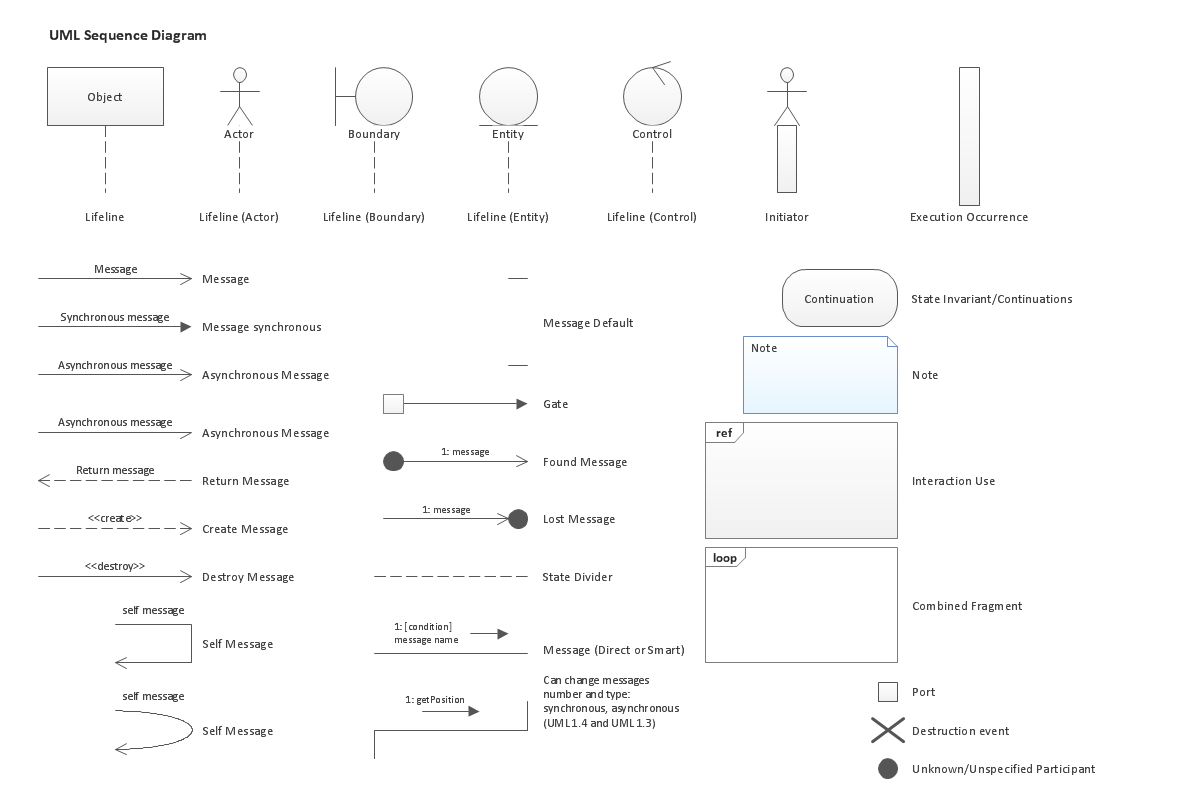
UML Sequence Diagram shows object interactions arranged in time sequence, how processes operate with one another and in what order and illustrate the sequence of messages exchanged between the objects and classes involved in the scenario.
IDEF3 Standard
Use Case Diagrams technology. IDEF3 Standard is intended for description and further analysis of technological processes of an enterprise. Using IDEF3 standard it is possible to examine and model scenarios of technological processes.
 IDEF Business Process Diagrams
Use the IDEF Business Process Diagrams solution to create effective database designs and object-oriented designs, following the integration definition methodology.
Active Directory Diagram
Active Directory Diagram represents the scheme of correlations of service components with the preset degree of the detailed elaboration. Such diagram lets plan and service the existing network quicker and more qualitatively and presents the clear picture of the network structure in graphical format.With the help of ConceptDraw PRO extended with Active Directory Diagrams Solution from the Computer and Networks Area you can easily and quickly create the highly detailed Active Directory Diagram.
 Specification and Description Language (SDL)
For people in the field of systems engineering or system design, working with specification and description language (sdl) and finite state machines (fsm).
UML Diagram Types List
Two types of diagrams are used in UML: Structure Diagrams and Behavior Diagrams. Behavior Diagrams represent the processes proceeding in a modeled environment. Structure Diagrams represent the elements that compose the system.UML Notation
Unified Modeling Language (UML) is a language of graphic description for object modeling in the field of software engineering. UML was created for definition, visualization, designing of software systems. UML is an open standard that uses graphic notations for creating visual models of object-oriented software systems.Two types of diagrams are used in UML: Structure Diagrams and Behavior Diagrams. Behavior Diagrams represent the processes proceeding in a modeled environment. Structure Diagrams represent the elements that compose the system.
- Simbol Simbol State Transition Diagram
- UML state machine diagram - Template | Design elements - Bank ...
- Free Software To Draw State Transition Diagram
- Construction And Schematic Symbol
- Design elements - Bank UML state machine diagram | Design ...
- Symbol With Meaning In Design Of Machine Element
- State Transition Diagram
- Design elements - UML state machine diagrams | Computer ...
- Design elements - Switches and relays | Symbol Of A Electrical ...
- Machine Design Symbols
- ERD | Entity Relationship Diagrams, ERD Software for Mac and Win
- Flowchart | Basic Flowchart Symbols and Meaning
- Flowchart | Flowchart Design - Symbols, Shapes, Stencils and Icons
- Flowchart | Flow Chart Symbols
- Electrical | Electrical Drawing - Wiring and Circuits Schematics
- Flowchart | Common Flowchart Symbols
- Flowchart | Common Flowchart Symbols


