 Seven Management and Planning Tools
Seven Management and Planning Tools solution extends ConceptDraw PRO and ConceptDraw MINDMAP with features, templates, samples and libraries of vector stencils for drawing management mind maps and diagrams.
 Quality Mind Map
This solution extends ConceptDraw MINDMAP software with Quality Management Mind Maps (Presentations, Meeting Agendas, Problem to be solved).
 Fishbone Diagrams
The Fishbone Diagrams solution extends ConceptDraw PRO v10 software with the ability to easily draw the Fishbone Diagrams (Ishikawa Diagrams) to clearly see the cause and effect analysis and also problem solving. The vector graphic diagrams produced using this solution can be used in whitepapers, presentations, datasheets, posters, and published technical material.
 Management
This solution extends ConceptDraw PRO v9 and ConceptDraw MINDMAP v7 with Management Diagrams and Mind Maps (decision making, scheduling, thinking ideas, problem solving, business planning, company organizing, SWOT analysis, preparing and holding meetings
 Entity-Relationship Diagram (ERD)
Entity-Relationship Diagram (ERD) solution extends ConceptDraw PRO software with templates, samples and libraries of vector stencils from drawing the ER-diagrams by Chen's and crow’s foot notations.
 PM Response
The PM Response solution extends the functional abilities in project management for all three ConceptDraw products by helping to improve the response time to project changes, to plan on how to effectively respond on issues and events impacting the project. It supplies the project managers, team leaders, and all other project participants with wide abilities of iteration planning, creative collaboration, effective decision-making, discussions of the project layout approaches and solving the project challenges, lets them use mind mapping technique for iteration planning and applying the project changes, to represent the projects data as Mind Maps and use them to construct the clear plans, to convert project maps to project implementations, to use different kinds of Visual diagrams to solve the current project problems and to make correct decisions, to plan resources usage and to respond to changes in the project environment.
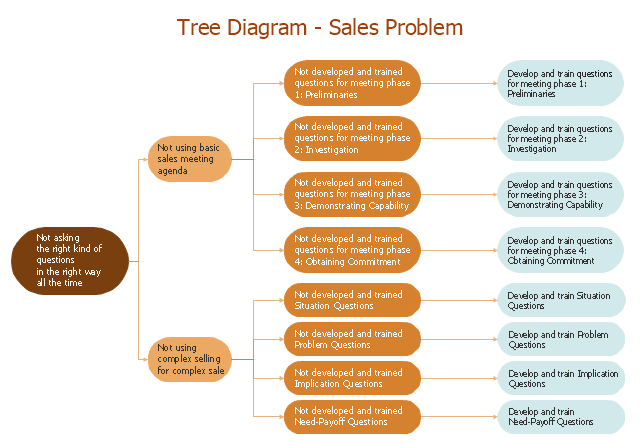
"Root cause analysis (RCA) is a method of problem solving that tries to identify the root causes of faults or problems. ...
RCA (in steps 3, 4 and 5) forms the most critical part of successful corrective action, because it directs the corrective action at the true root cause of the problem. Knowing the root cause is secondary to the goal of prevention, but without knowing the root cause, it is not possible to determine what an effective corrective action for the defined problem would be. ...
3. Ask "why" and identify the causes associated with each step in the sequence towards the defined problem or event. "Why" is taken to mean "What were the factors that directly resulted in the effect?"
4. Classify causes into causal factors that relate to an event in the sequence and root causes, that if eliminated, can be agreed to have interrupted that step of the sequence chain.
5. Identify all other harmful factors that have equal or better claim to be called "root causes." If there are multiple root causes, which is often the case, reveal those clearly for later optimum selection." [Root cause analysis. Wikipedia]
This root cause analysis (RCA) tree diagram example "Sale problem solution" was created using the ConceptDraw PRO diagramming and vector drawing software extended with the Seven Management and Planning Tools solution from the Management area of ConceptDraw Solution Park.
RCA diagram
 ATM UML Diagrams
The ATM UML Diagrams solution lets you create ATM solutions and UML examples. Use ConceptDraw PRO as a UML diagram creator to visualize a banking system.
 Quality
This solution extends ConceptDraw PRO v9 and ConceptDraw MINDMAP v7 with Quality Management Diagrams (Total Quality Management Diagrams, Timelines, Workflows, Value Stream Maps) and Mind Maps (Presentations, Meeting Agendas, Problem to be solved).
 Seven Management and Planning Tools
Seven Management and Planning Tools solution extends ConceptDraw PRO and ConceptDraw MINDMAP with features, templates, samples and libraries of vector stencils for drawing management mind maps and diagrams.
UML Process Diagram Example

Process Flowchart


 Value Stream Mapping
Value stream mapping solution extends ConceptDraw PRO software with templates, samples and vector stencils for drawing the Value Stream Maps (VSM) in lean manufacturing practice.
 Fishbone Diagram
Fishbone Diagrams solution extends ConceptDraw PRO software with templates, samples and library of vector stencils for drawing the Ishikawa diagrams for cause and effect analysis.
 Accounting Flowcharts
Accounting Flowcharts solution extends ConceptDraw PRO software with templates, samples and library of vector stencils for drawing the accounting flow charts.
Software development with ConceptDraw Products

 SWOT Analysis
SWOT and TOWS Matrix Diagrams solution extends ConceptDraw PRO and ConceptDraw MINDMAP software with features, templates, samples and libraries of vector stencils for drawing SWOT and TOWS analysis matrices and mind maps.
- UML Sequence Diagram Example. SVG Vectored UML Diagrams ...
- UML Class Diagram Generalization Example | UML Sample Project ...
- UML Use Case Diagram Example Registration System | Rapid UML ...
- Rapid UML | Rapid UML | Timeline Diagrams | Sequence Diagram ...
- Root cause analysis tree diagram template
- Event-driven Process Chain Diagrams EPC | Entity Relationship ...
- Venn Diagram Examples for Problem Solving . Venn Diagram as a ...
- UML sequence diagram - GET request | Diagramming Software for ...
- Diagramming Software for Design UML Timing Diagrams | Timing ...
- UML activity diagram template
- Schedule pie chart - Daily action plan | UML sequence diagram ...
- UML Tool & UML Diagram Examples | Rapid UML | Rapid UML ...
- Venn Diagram Examples for Problem Solving . Computer Science ...
- Diagramming Software for designing UML Sequence Diagrams ...
- UML Activity Diagram | UML Class Diagram Generalization Example ...
- UML Business Process | UML Process Diagram Example | UML ...
- UML Tool & UML Diagram Examples | Rapid UML | UML Business ...
- Diagramming Software for Design UML Collaboration Diagrams ...
- Diagramming Software for Design UML Activity Diagrams | Software ...
- UML Activity Diagram | Diagramming Software for Design UML ...
- ERD | Entity Relationship Diagrams, ERD Software for Mac and Win
- Flowchart | Basic Flowchart Symbols and Meaning
- Flowchart | Flowchart Design - Symbols, Shapes, Stencils and Icons
- Flowchart | Flow Chart Symbols
- Electrical | Electrical Drawing - Wiring and Circuits Schematics
- Flowchart | Common Flowchart Symbols
- Flowchart | Common Flowchart Symbols