"A schedule or timetable is a basic time management tool consisting of a list of times at which possible tasks, events, or actions are intended to take place, or a sequence of events in the chronological order in which such things are intended to take place. The process of creating a schedule - deciding how to order these tasks and how to commit resources between the variety of possible tasks - is called scheduling, and a person responsible for making a particular schedule may be called a scheduler. Making and following schedules is a fundamental human activity, and learning to do these things effectively is one of the most basic life skills. There are a wide variety of situations in which schedules are necessary, or at least useful.
Schedules are useful for both short periods, such as a daily or weekly schedule, and for long term planning with respect to periods of several months or years. They are often made using a calendar, where the person making the schedule can note the dates and times at which various events are planned to occur. Schedules that do not set forth specific times for events to occur may instead list an expected order in which events either can or must take place." [Schedule. Wikipedia]
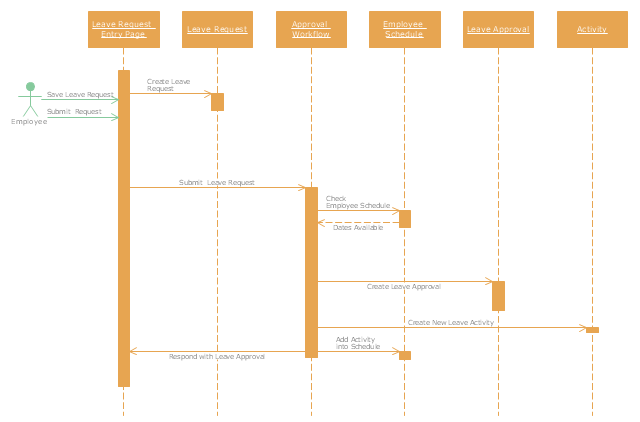
The UML sequence diagram example "Checking process" was created using the ConceptDraw PRO diagramming and vector drawing software extended with the Rapid UML solution from the Software Development area of ConceptDraw Solution Park.
Schedules are useful for both short periods, such as a daily or weekly schedule, and for long term planning with respect to periods of several months or years. They are often made using a calendar, where the person making the schedule can note the dates and times at which various events are planned to occur. Schedules that do not set forth specific times for events to occur may instead list an expected order in which events either can or must take place." [Schedule. Wikipedia]
The UML sequence diagram example "Checking process" was created using the ConceptDraw PRO diagramming and vector drawing software extended with the Rapid UML solution from the Software Development area of ConceptDraw Solution Park.
UML sequence diagram
 Timeline Diagrams
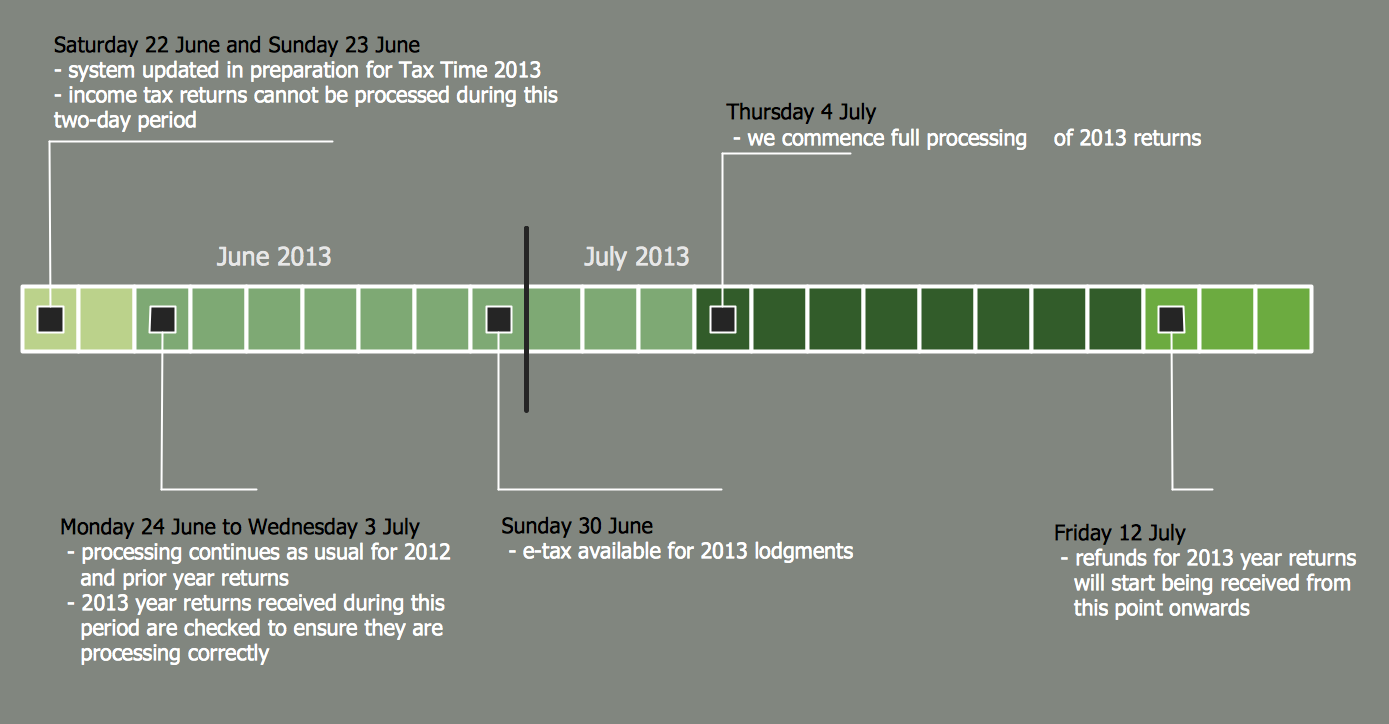
Timeline Diagrams solution extends ConceptDraw DIAGRAM diagramming software with samples, templates and libraries of specially developed smart vector design elements of timeline bars, time intervals, milestones, events, today marker, legend, and many other elements with custom properties, helpful for professional drawing clear and intuitive Timeline Diagrams. Use it to design simple Timeline Diagrams and designate only the main project stages, or highly detailed Timeline Diagrams depicting all project tasks, subtasks, milestones, deadlines, responsible persons and other description information, ideal for applying in presentations, reports, education materials, and other documentation.
PERT Chart Software

ConceptDraw DIAGRAM is a powerful diagramming and vector drawing software for designing professional looking PERT Charts quick and easy.
Fishbone Diagram Problem Solving

To design easily the Fishbone diagram, you can use a special ConceptDraw DIAGRAM vector graphic and diagramming software which contains the powerful tools for Fishbone diagram problem solving offered by Fishbone Diagrams solution for the Management area of ConceptDraw Solution Park.
Timeline Diagrams
ConceptDraw DIAGRAM extended with Timeline Diagrams solution from the Management area of ConceptDraw Solution Park is a powerful software for fast and easy drawing useful and great-looking timeline diagrams.
Bar Diagrams for Problem Solving. Create event management bar charts with Bar Graphs Solution

UML Software
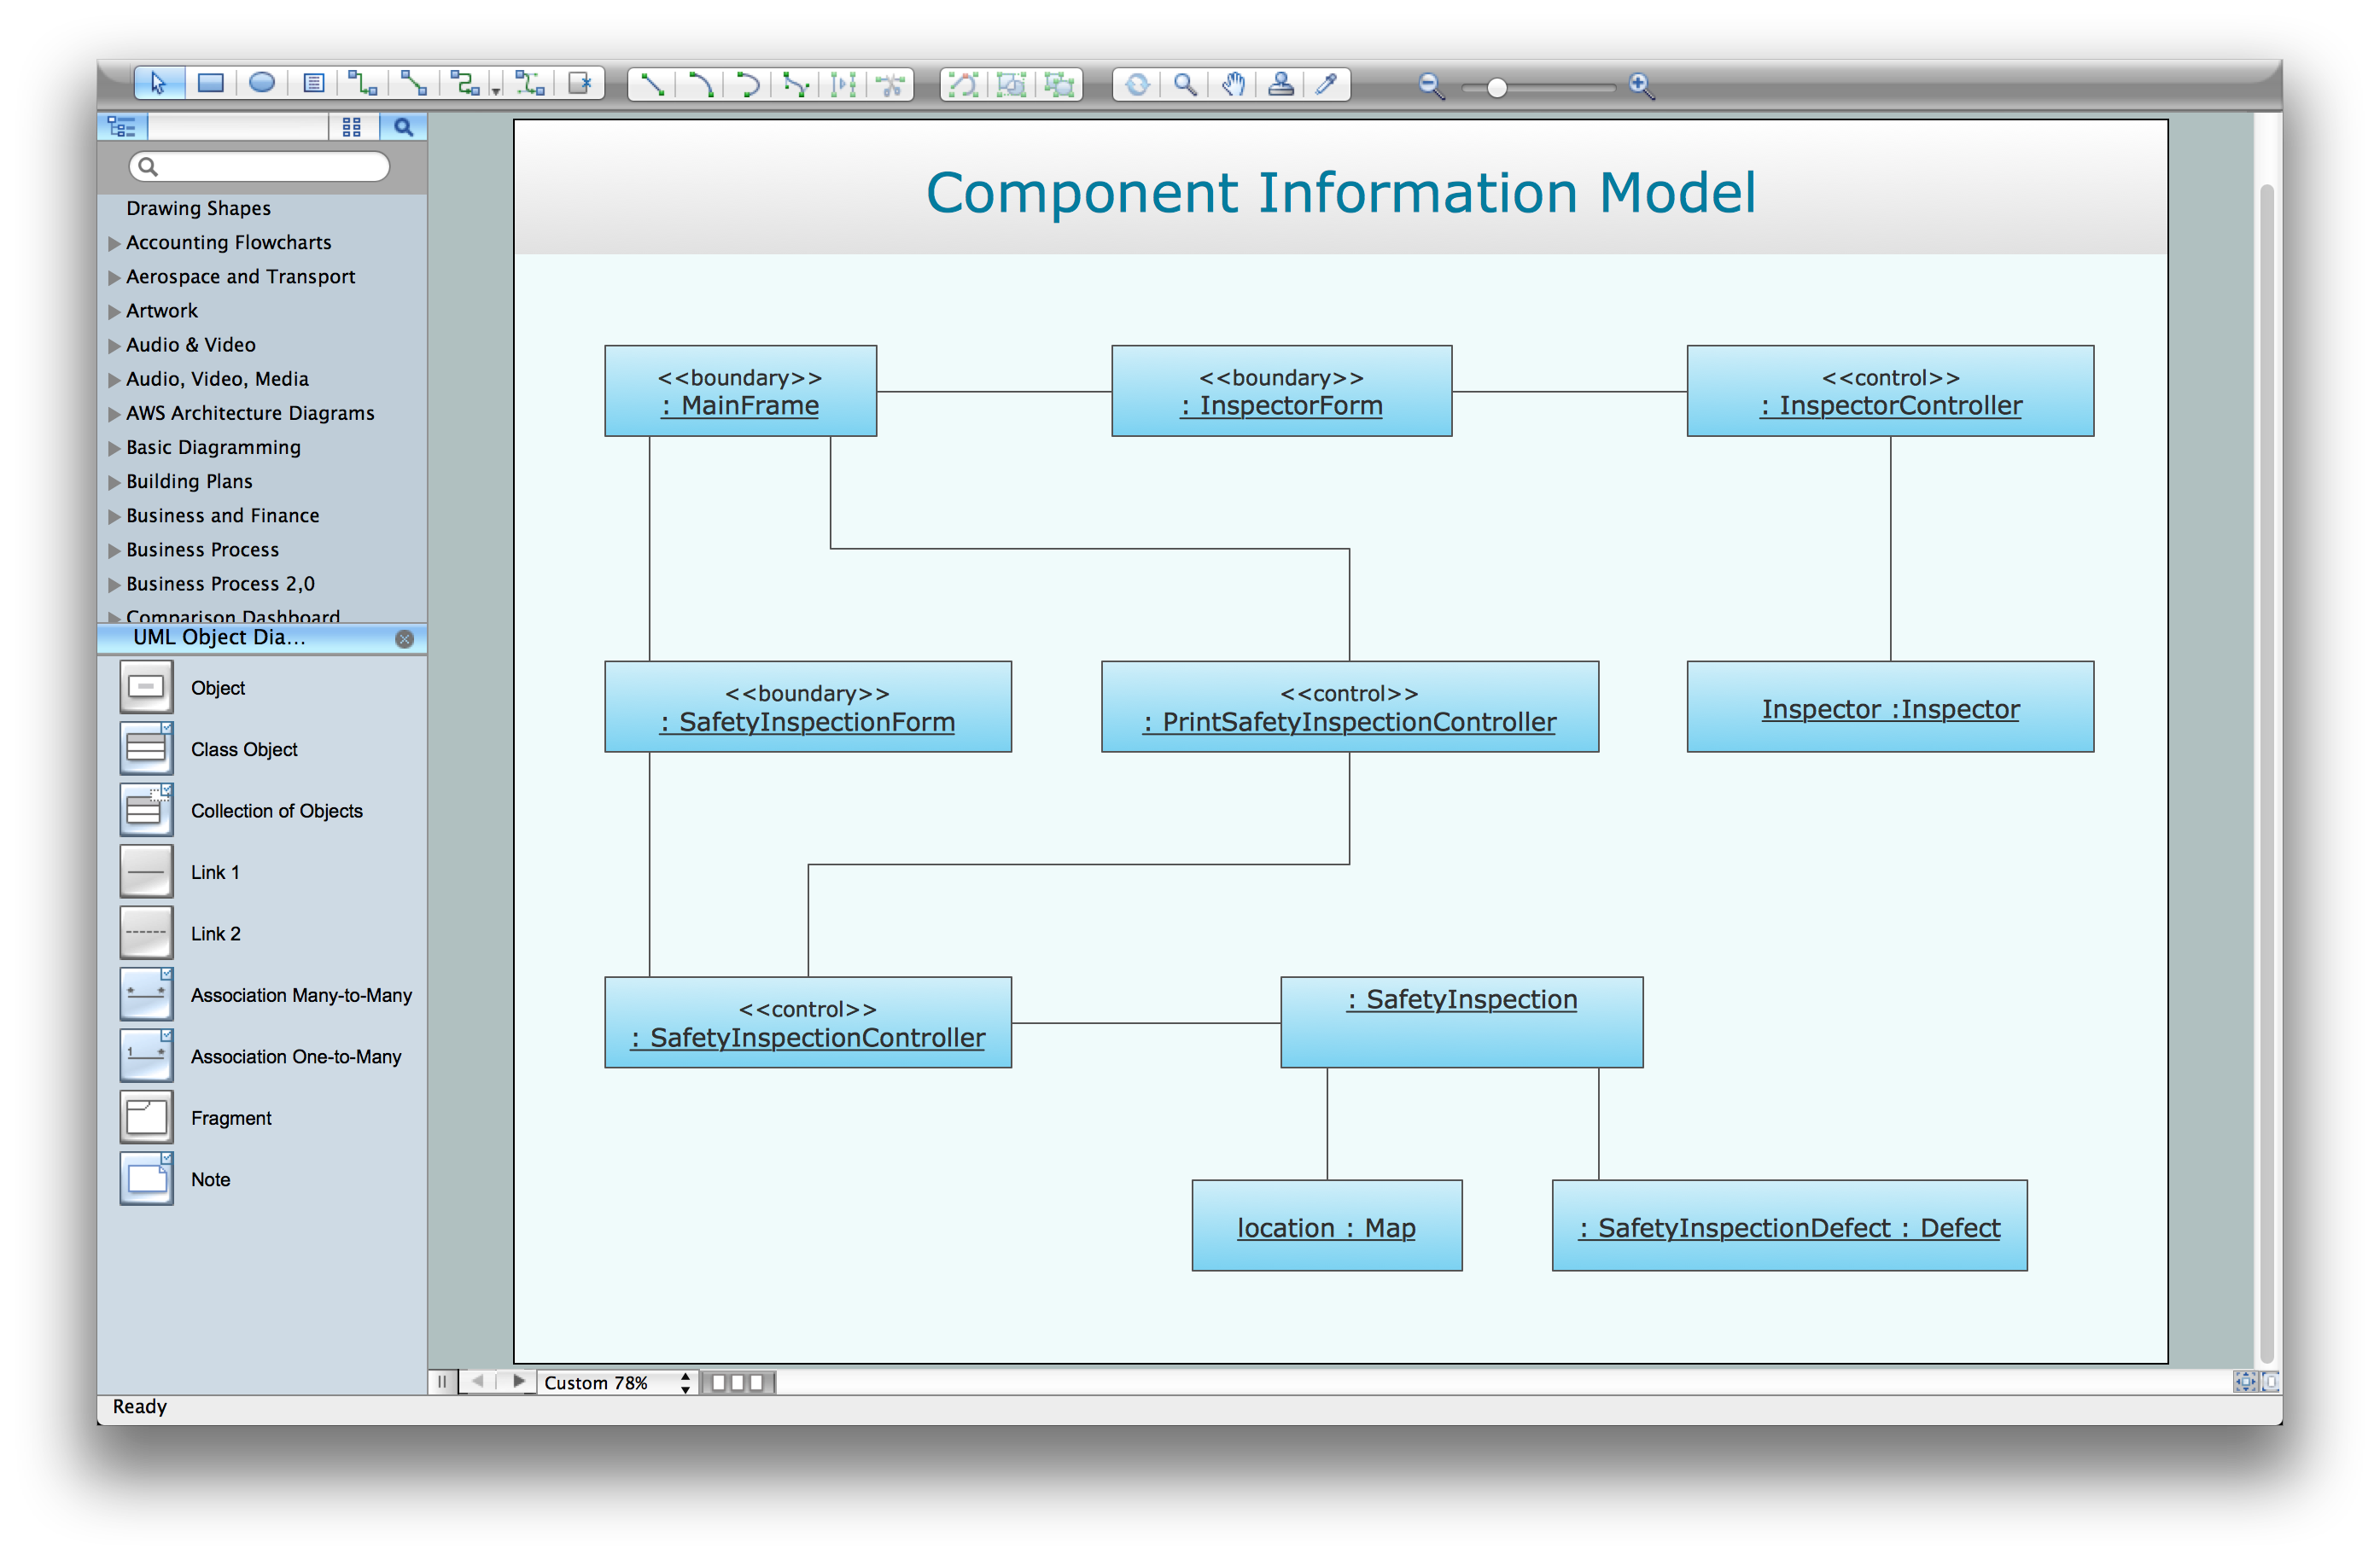
The Rapid UML Solution for ConceptDraw DIAGRAM presentsthe intuitive RapidDraw interface that helps you to make the UML Diagram of any of these 13 types quick and easy.
Diagramming Software for Design UML Timing Diagrams


 ATM UML Diagrams
The ATM UML Diagrams solution lets you create ATM solutions and UML examples. Use ConceptDraw DIAGRAM as a UML diagram creator to visualize a banking system.
Event-Driven Process Chain Diagram Software
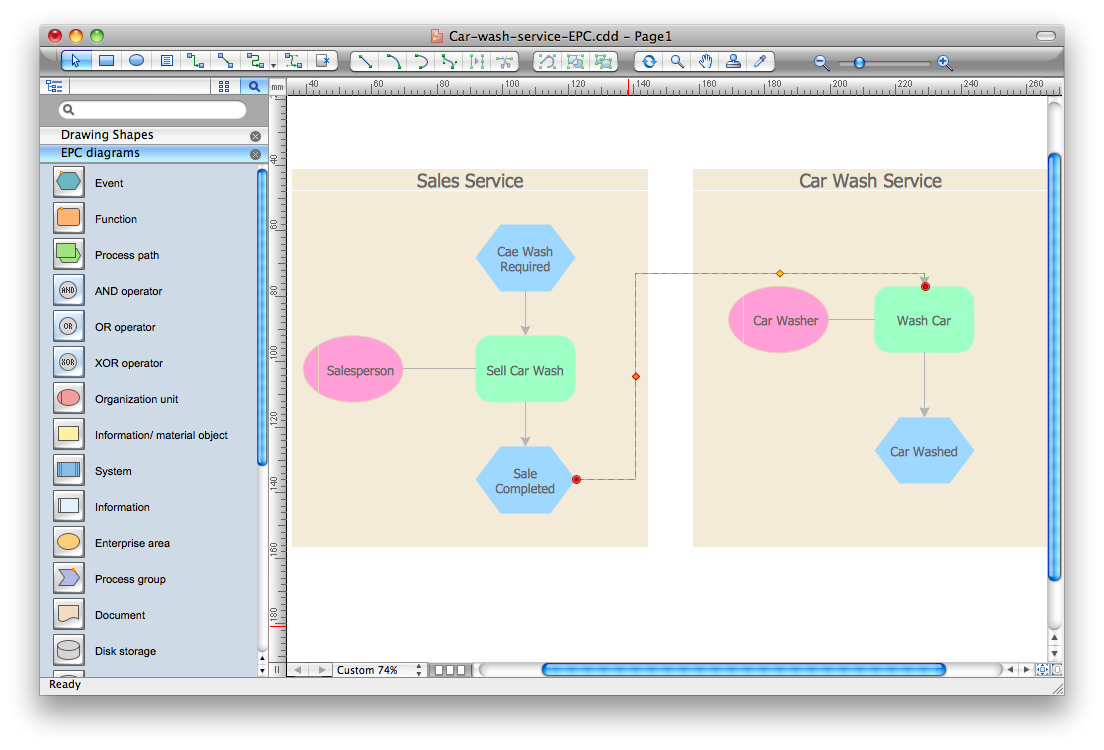
- Event -driven Process Chain Diagrams | UML sequence diagram ...
- Order processing center - UML sequence diagram | UML sequence ...
- Rapid UML | ATM UML Diagrams | UML sequence diagram ...
- Design elements - UML timing diagrams | UML sequence diagram ...
- Uml Diagram Sequence
- ATM Sequence diagram | Process Flowchart | Event -driven Process ...
- Entity-Relationship Diagram (ERD) | Event Schedule Maker
- UML Sequence Diagram . Design Elements | UML Collaboration ...
- Using Fishbone Diagrams for Problem Solving | UML Sequence ...
- UML sequence diagram
- ERD | Entity Relationship Diagrams, ERD Software for Mac and Win
- Flowchart | Basic Flowchart Symbols and Meaning
- Flowchart | Flowchart Design - Symbols, Shapes, Stencils and Icons
- Flowchart | Flow Chart Symbols
- Electrical | Electrical Drawing - Wiring and Circuits Schematics
- Flowchart | Common Flowchart Symbols
- Flowchart | Common Flowchart Symbols