UML Use Case Diagram Example - Taxi Service

This sample shows the work of the taxi service and is used by taxi stations, by airports, in the tourism field and delivery service.
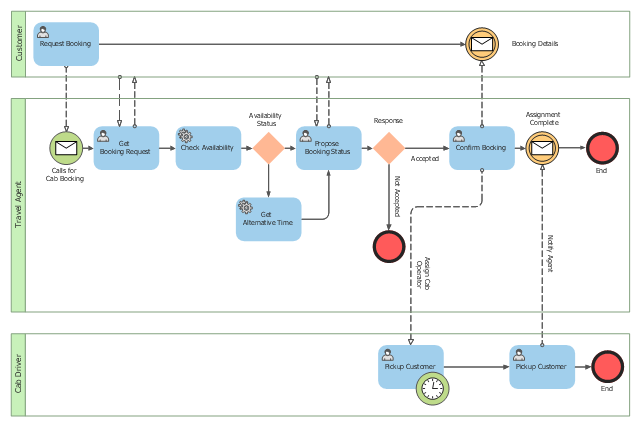
This BPMN (Business Process Model and Notation) collaboration diagram sample depicts interactions between customer, travel agent and cab driver, which are defined as a sequence of activities, and represent the message exchange during a cab booking process.
"Business process modeling is used to communicate a wide variety of information to a wide variety of audiences. BPMN is designed to cover this wide range of usage and allows modeling of end-to-end business processes to allow the viewer of the Diagram to be able to easily differentiate between sections of a BPMN Diagram. There are three basic types of sub-models within an end-to-end BPMN model: Private (internal) business processes, Abstract (public) processes, and Collaboration (global) processes...
Collaboration (global) processes.
A collaboration process depicts the interactions between two or more business entities. These interactions are defined as a sequence of activities that represent the message exchange patterns between the entities involved. Collaboration processes may be contained within a Pool and the different participant business interactions are shown as Lanes within the Pool. In this situation, each Lane would represent two participants and a direction of travel between them. They may also be shown as two or more Abstract Processes interacting through Message Flow. These processes can be modeled separately or within a larger BPMN Diagram to show the Associations between the collaboration process activities and other entities. If the collaboration process is in the same Diagram as one of its corresponding private business process, then the activities that are common to both processes can be associated." [Business Process Model and Notation. Wikipedia]
The business process modeling diagram example "Cab booking public process - Collaboration BPMN 2.0 diagram" was designed using the ConceptDraw PRO diagramming and vector drawing software extended with the Business Process Diagram solution from the Business Processes area of ConceptDraw Solution Park.
Business process modeling
Business Process Modeling Notation Template
 B2B process diagram BPMN 2.0 - Cab booking process")
 Business Process Diagrams
Business Process Diagrams solution extends the ConceptDraw PRO BPM software with RapidDraw interface, templates, samples and numerous libraries based on the BPMN 1.2 and BPMN 2.0 standards, which give you the possibility to visualize equally easy simple and complex processes, to design business models, to quickly develop and document in details any business processes on the stages of project’s planning and implementation.
UML Diagram Types List

Process Flowchart


Process Flow Chart Symbols

It is incredibly convenient to use the ConceptDraw PRO software extended with Flowcharts Solution from the "Diagrams" Area of ConceptDraw Solution Park for designing professional looking Process Flow Charts.
The Building Blocks Used in EPC Diagrams
")
ConceptDraw PRO - software that reduces the time needed to create a EPC diagrams.
Activity Network (PERT) Chart

This diagram is constructed as part of the process in creating a schedule of corrective actions. The Activity Network Chart (PERT) shows the logical connections and consequence of tasks to be performed. It displays the time period for problem solving and the implementation of all activities through the critical path.
Selecting & Creating Flowcharts

Affinity Diagram

ConceptDraw PRO

Accounting Flowchart

How Do You Make An Accounting Process Flowchart?

Tips, Methods and Symbols on How to Create Flowcharts for an Accounting Information System.
Linux Audit Flowchart Example. Flowchart Examples

This flowchart example describing auditd, the linux audit tool.
- Sequence Diagram For Cab Booking System
- Sequence Diagram For Online Taxi Booking System
- Sequence Diagram For Online Cab Reservation System
- Sequence Diagram For Online Reservation System
- Sequence Diagram Of Cab Booking System
- Website Sequence Diagram For Event Booking Management System
- Use Case For Taxi Booking System
- System Sequence Diagram For A Reservation Subsystem Use Case ...
- Use Case Diagram For Online Cab Booking System
- Class Diagram For Cab Booking System
- Create A System Sequence Diagram For The Reservation ...
- Sequence Diagram Of Online Reservation System
- Sequence Diagram For Cab Booking Management
- Flowchart Of Online Cab Booking System
- Component Diagram For Cab Booking System
- UML sequence diagram - Ticket processing system | UML Tool ...
- Online Cab Booking System Class Diagram
- UML Use Case Diagram Example - Taxi Service | Diagramming ...
- UML Use Case Diagram Example - Taxi Service | Business Process ...
- Flow Chart Of Online Taxi Booking System
- ERD | Entity Relationship Diagrams, ERD Software for Mac and Win
- Flowchart | Basic Flowchart Symbols and Meaning
- Flowchart | Flowchart Design - Symbols, Shapes, Stencils and Icons
- Flowchart | Flow Chart Symbols
- Electrical | Electrical Drawing - Wiring and Circuits Schematics
- Flowchart | Common Flowchart Symbols
- Flowchart | Common Flowchart Symbols