Cisco Security. Cisco icons, shapes, stencils and symbols
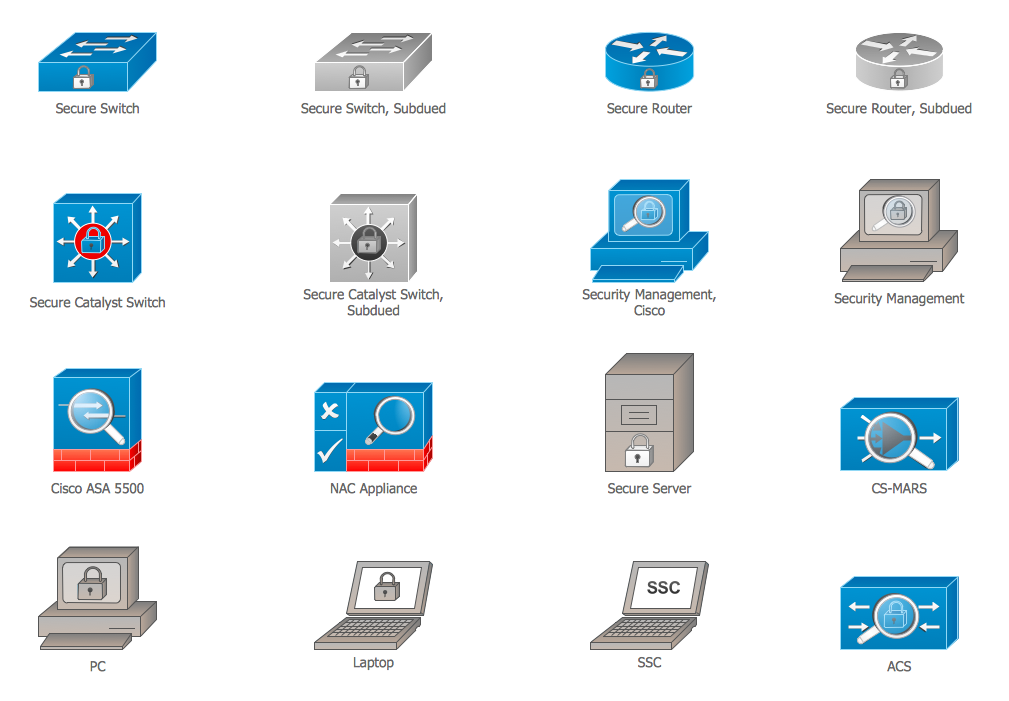
The ConceptDraw vector stencils library "Cisco Security" contains 16 symbols of security devices and equipment for drawing the computer network diagrams using the ConceptDraw DIAGRAM diagramming and vector drawing software.
 Entity-Relationship Diagram (ERD)
Entity-Relationship Diagram (ERD) solution extends ConceptDraw DIAGRAM software with templates, samples and libraries of vector stencils from drawing the ER-diagrams by Chen's and crow’s foot notations.
 Entity-Relationship Diagram (ERD)
An Entity-Relationship Diagram (ERD) is a visual presentation of entities and relationships. That type of diagrams is often used in the semi-structured or unstructured data in databases and information systems. At first glance ERD is similar to a flowch
 Security and Access Plans
The Security and Access Plans solution may be utilized in order to develop detailed equipment and cabling layout plans, blueprints, and wiring diagrams on internal and external security and access control systems, video surveillance and closed-circuit television (CCTV) systems. IT specialists, security managers, and other guards may use it to quickly design security plans and access plans, security chart, physical security plan, access chart, or access scheme on desire.
 ConceptDraw Solution Park
ConceptDraw Solution Park collects graphic extensions, examples and learning materials
 Data Flow Diagrams (DFD)
Data Flow Diagrams solution extends ConceptDraw DIAGRAM software with templates, samples and libraries of vector stencils for drawing the data flow diagrams (DFD).
 Network Security Diagrams
The Network Security Diagrams solution presents a large collection of predesigned cybersecurity vector stencils, cliparts, shapes, icons and connectors to help you succeed in designing professional and accurate Network Security Diagrams, Network Security Infographics to share knowledge about effective ways of networks protection with help of software and network security devices of different cyber security degrees, Network Plans for secure wireless network, Computer Security Diagrams to visually tell about amazing possibilities of IT security solutions. The samples and examples reflect the power of ConceptDraw DIAGRAM software in drawing Network Security Diagrams, give the representation about variety of existing types of attacks and threats, help to realize their seriousness and the methods to deal with them.
Example of DFD for Online Store (Data Flow Diagram)
Data flow diagrams (DFDs) reveal relationships among and between the various components in a program or system. DFDs are an important technique for modeling a system’s high-level detail by showing how input data is transformed to output results through a sequence of functional transformations.Example of DFD for Online Store shows the Data Flow Diagram for online store and interactions between the Visitors, Customers and Sellers, as well as Website Information and User databases.

 Fishbone Diagrams
The Fishbone Diagrams solution extends ConceptDraw DIAGRAM software with the ability to easily draw the Fishbone Diagrams (Ishikawa Diagrams) to clearly see the cause and effect analysis and also problem solving. The vector graphic diagrams produced using this solution can be used in whitepapers, presentations, datasheets, posters, and published technical material.
ConceptDraw DIAGRAM Network Diagram Tool
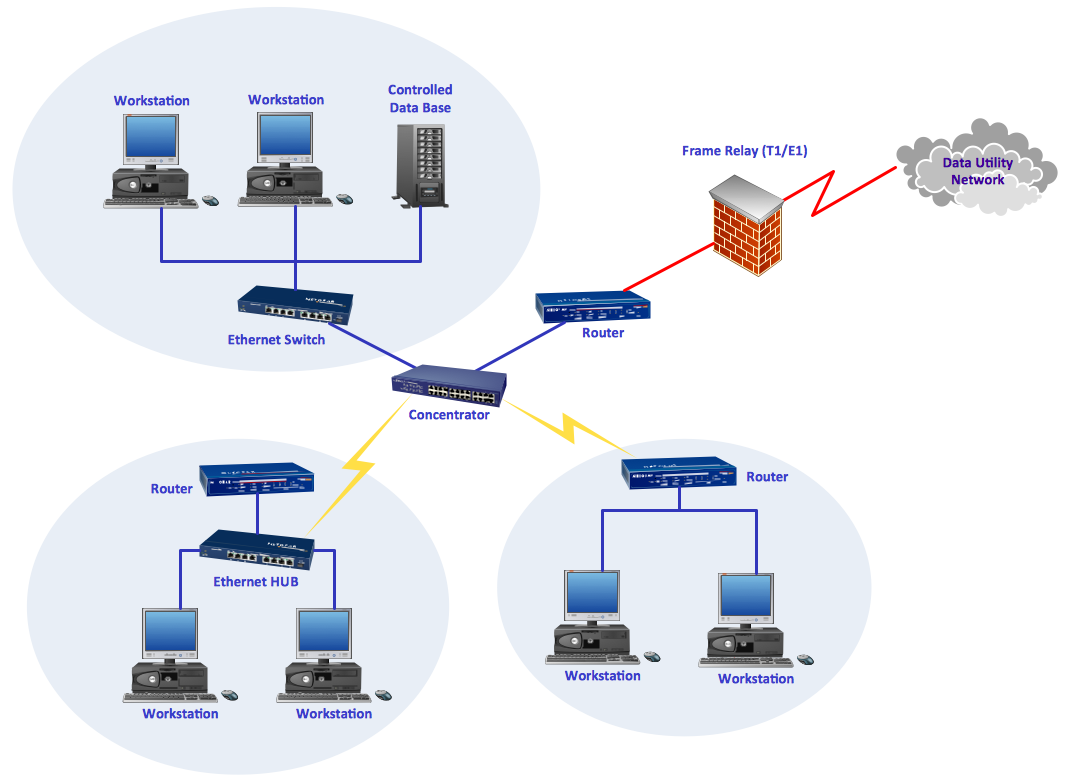
With ConceptDraw DIAGRAM you can diagram a network or create a computer network diagram using specialized libraries of network components such as computers, hubs, smart connectors etc. that simulate network design topologies and devices, network architectures (all these shapes are parts of network diagram tool ConceptDraw DIAGRAM).
 Block Diagrams
Block diagrams solution extends ConceptDraw DIAGRAM software with templates, samples and libraries of vector stencils for drawing the block diagrams.
Cloud Computing Architecture Diagrams
For documenting the Cloud Computing Architecture with a goal to facilitate the communication between stakeholders are successfully used the Cloud Computing Architecture diagrams. It is convenient and easy to draw various Cloud Computing Architecture diagrams in ConceptDraw DIAGRAM software with help of tools of the Cloud Computing Diagrams Solution from the Computer and Networks Area of ConceptDraw Solution Park.ER Diagram for Cloud Computing
The entity–relationship (ER) model is a data model that lets graphically represent the information system and depict the relationships between people, objects, concepts, places, and events within a given system. It is also convenient to use the ER Diagram for Cloud computing representation and description the Cloud computing architecture, design them with pleasure using the extensive tools of the Cloud Computing Diagrams solution from the Computers and Network area of ConceptDraw Solution Park.UML Use Case Diagram Example. Social Networking Sites Project
UML Diagrams Social Networking Sites Project. This sample was created in ConceptDraw DIAGRAM diagramming and vector drawing software using the UML Use Case Diagram library of the Rapid UML Solution from the Software Development area of ConceptDraw Solution Park.This sample shows the Facebook Socio-health system and is used at the projection and creating of the social networking sites.
- Security Management System Er Diagram
- Cable Operators Management System Er Diagram
- Database Security Management System Er Diagram
- Transport Management System College ER Diagrams
- Fishbone Diagram | Entity-Relationship Diagram ( ERD ) | Security ...
- Entity-Relationship Diagram ( ERD ) | Security and Access Plans ...
- Draw Er Diagram For College Management System
- Erd Example Of Monitoring System
- Erd On Bus Transport Management System Of College
- Cloud Transport Management System Er Diagram
- Fishbone Diagram | Entity Relationship Diagram Software ...
- Entity-Relationship Diagram ( ERD ) | Security and Access Plans ...
- Er Diagram Of College Management System And Explanation
- College Management System Eerd Diagram
- Cross-Functional Flowcharts | Network Security Diagrams | Health ...
- Entity-Relationship Diagram ( ERD ) | Audit Flowcharts | Security and ...
- Er Diagram For Library Management System Of College
- Er Diagram For Cyber Cafe Management System
- Network Security Devices | Network Security Architecture Diagram ...
- Entity Relationship Diagram For Vehicle Management System
- ERD | Entity Relationship Diagrams, ERD Software for Mac and Win
- Flowchart | Basic Flowchart Symbols and Meaning
- Flowchart | Flowchart Design - Symbols, Shapes, Stencils and Icons
- Flowchart | Flow Chart Symbols
- Electrical | Electrical Drawing - Wiring and Circuits Schematics
- Flowchart | Common Flowchart Symbols
- Flowchart | Common Flowchart Symbols


