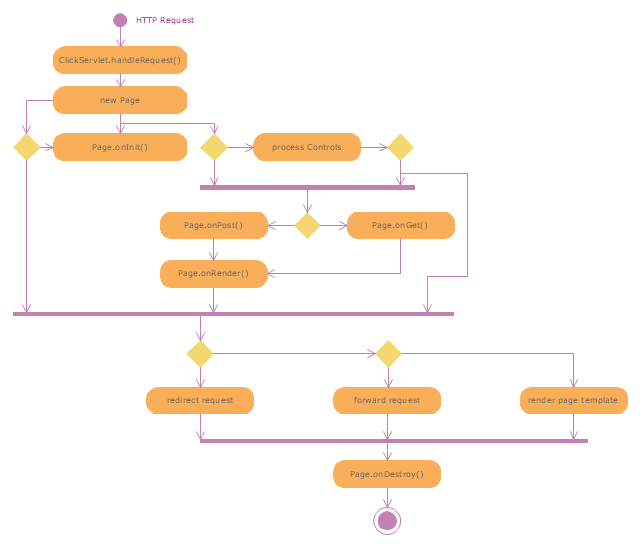
"Web container (also known as a Servlet container) is the component of a web server that interacts with Java servlets. A web container is responsible for managing the lifecycle of servlets, mapping a URL to a particular servlet and ensuring that the URL requester has the correct access rights. A web container implements the web component contract of the Java EE architecture, specifying a runtime environment for web components that includes security, concurrency, lifecycle management, transaction, deployment, and other services. A web container provides the same services as a JSP container as well as a federated view of the Java EE platform APIs." [Web container. Wikipedia]
The UML activity diagram example "Servlet container" was created using the ConceptDraw PRO diagramming and vector drawing software extended with the Rapid UML solution from the Software Development area of ConceptDraw Solution Park.
The UML activity diagram example "Servlet container" was created using the ConceptDraw PRO diagramming and vector drawing software extended with the Rapid UML solution from the Software Development area of ConceptDraw Solution Park.
UML activity diagram
 Security and Access Plans
The Security and Access Plans solution may be utilized in order to develop detailed equipment and cabling layout plans, blueprints, and wiring diagrams on internal and external security and access control systems, video surveillance and closed-circuit television (CCTV) systems. IT specialists, security managers, and other guards may use it to quickly design security plans and access plans, security chart, physical security plan, access chart, or access scheme on desire.
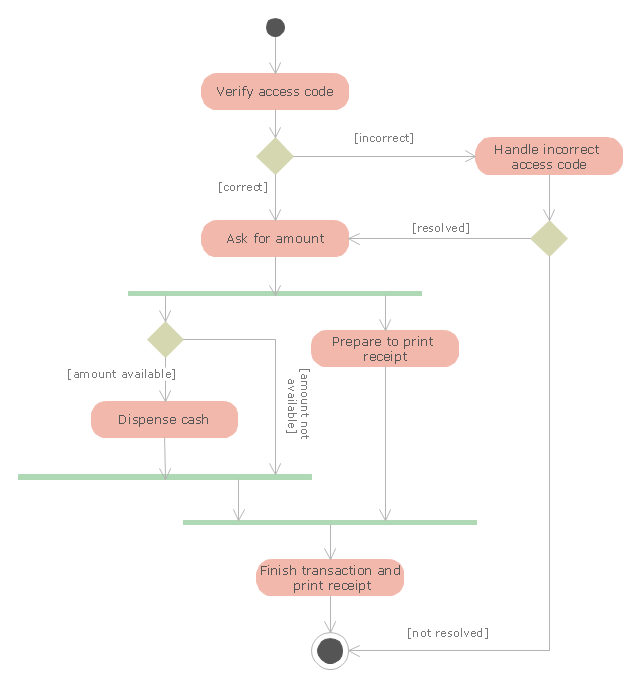
"An automated teller machine or automatic teller machine" (ATM) (American, Australian, Singaporean, Indian, and Hiberno-English), also known as an automated banking machine (ABM) (Canadian English), cash machine, cashpoint, cashline or hole in the wall (British, South African, and Sri Lankan English), is an electronic telecommunications device that enables the clients of a financial institution to perform financial transactions without the need for a cashier, human clerk or bank teller.
On most modern ATMs, the customer is identified by inserting a plastic ATM card with a magnetic stripe or a plastic smart card with a chip that contains a unique card number and some security information such as an expiration date or CVVC (CVV). Authentication is provided by the customer entering a personal identification number (PIN). The newest ATM at Royal Bank of Scotland allows customers to withdraw cash up to £100 without a card by inputting a six-digit code requested through their smartphones.
Using an ATM, customers can access their bank accounts in order to make cash withdrawals, get debit card cash advances, and check their account balances as well as purchase pre-paid mobile phone credit. If the currency being withdrawn from the ATM is different from that which the bank account is denominated in (e.g.: Withdrawing Japanese yen from a bank account containing US dollars), the money will be converted at an official wholesale exchange rate. Thus, ATMs often provide one of the best possible official exchange rates for foreign travellers, and are also widely used for this purpose." [Automated teller machine. Wikipedia]
The UML activity diagram example "Cash withdrawal from ATM" was created using the ConceptDraw PRO diagramming and vector drawing software extended with the Rapid UML solution from the Software Development area of ConceptDraw Solution Park.
UML activity diagram
 Timeline Diagrams
Timeline Diagrams solution extends ConceptDraw DIAGRAM diagramming software with samples, templates and libraries of specially developed smart vector design elements of timeline bars, time intervals, milestones, events, today marker, legend, and many other elements with custom properties, helpful for professional drawing clear and intuitive Timeline Diagrams. Use it to design simple Timeline Diagrams and designate only the main project stages, or highly detailed Timeline Diagrams depicting all project tasks, subtasks, milestones, deadlines, responsible persons and other description information, ideal for applying in presentations, reports, education materials, and other documentation.
 Active Directory Diagrams
Active Directory Diagrams solution significantly extends the capabilities of ConceptDraw DIAGRAM software with special Active Directory samples, convenient template and libraries of Active Directory vector stencils, common icons of sites and services, icons of LDPA elements, which were developed to help you in planning and modelling network structures and network topologies, in designing excellently looking Active Directory diagrams, Active Directory Structure diagrams, and Active Directory Services diagram, which are perfect way to visualize detailed structures of Microsoft Windows networks, Active Directory Domain topology, Active Directory Site topology, Organizational Units (OU), and Exchange Server organization.
 Safety and Security
Safety and security solution extends ConceptDraw DIAGRAM software with illustration samples, templates and vector stencils libraries with clip art of fire safety, access and security equipment.
 Event-driven Process Chain Diagrams
Event-Driven Process Chain Diagrams solution extends ConceptDraw DIAGRAM functionality with event driven process chain templates, samples of EPC engineering and modeling the business processes, and a vector shape library for drawing the EPC diagrams and EPC flowcharts of any complexity. It is one of EPC IT solutions that assist the marketing experts, business specialists, engineers, educators and researchers in resources planning and improving the business processes using the EPC flowchart or EPC diagram. Use the EPC solutions tools to construct the chain of events and functions, to illustrate the structure of a business process control flow, to describe people and tasks for execution the business processes, to identify the inefficient businesses processes and measures required to make them efficient.
UML Diagram of Parking

UML Diagram of Parking - This diagram can be used for understanding the process of working the car parking, at the projection and construction the parking by building companies and for automation the existing parkings.
 Total Quality Management TQM Diagrams
Total Quality Management Diagrams solution extends ConceptDraw DIAGRAM software with samples, templates and vector stencils library for drawing the TQM flowcharts.
ConceptDraw DIAGRAM Network Diagram Tool


 Audit Flowcharts
Audit flowcharts solution extends ConceptDraw DIAGRAM software with templates, samples and library of vector stencils for drawing the audit and fiscal flow charts.
 Interactive Voice Response Diagrams
Interactive Voice Response Diagrams solution extends ConceptDraw DIAGRAM software with samples, templates and libraries of ready-to-use vector stencils that help create Interactive Voice Response (IVR) diagrams illustrating in details a work of interactive voice response system, the IVR system’s logical and physical structure, Voice-over-Internet Protocol (VoIP) diagrams, and Action VoIP diagrams with representing voice actions on them, to visualize how the computers interact with callers through voice recognition and dual-tone multi-frequency signaling (DTMF) keypad inputs.
 Computer Network Diagrams
Computer Network Diagrams solution extends ConceptDraw DIAGRAM software with samples, templates and libraries of vector icons and objects of computer network devices and network components to help you create professional-looking Computer Network Diagrams, to plan simple home networks and complex computer network configurations for large buildings, to represent their schemes in a comprehensible graphical view, to document computer networks configurations, to depict the interactions between network's components, the used protocols and topologies, to represent physical and logical network structures, to compare visually different topologies and to depict their combinations, to represent in details the network structure with help of schemes, to study and analyze the network configurations, to communicate effectively to engineers, stakeholders and end-users, to track network working and troubleshoot, if necessary.
 IDEF0 Diagrams
IDEF0 Diagrams visualize system models using the Integration Definition for Function Modeling (IDEF) methodology. Use them for analysis, development and integration of information and software systems, and business process modelling.
- UML activity diagram
- PM Presentations | Security and Access Plans | AWS | Activity ...
- PM Presentations | Security and Access Plans | AWS | Activity ...
- ATM UML Diagrams | UML activity diagram - Cash withdrawal from ...
- Security and Access Plans | PM Presentations | AWS | Activity ...
- UML activity diagram - Alarm trigger processing | Fire safety ...
- Remote Computer Monitering Activity Diagram
- Activity Diagram Of Network Security System
- Security and Access Plans | Process Flow Diagram | Activity ...
- Design elements - Alarm and access control | Security Plans | UML ...
- UML activity diagram - Cash withdrawal from ATM | UML Activity ...
- Activity Diagram For Network Security With Banking System
- UML Tool & UML Diagram Examples | UML Activity Diagram | Rapid ...
- Remote Computer Monitoring For Activity Diagram
- Draw A Activity Diagram For Compressing File
- Uml Activity Diagrams For C
- How To use House Electrical Plan Software | Activity Diagram For A ...
- Security and Access Plans | Security Plans | Fire and Emergency ...
- PM Presentations | Security and Access Plans | Network Glossary ...
- Purchase order processing UML activity diagram | Bank ATM use ...
- ERD | Entity Relationship Diagrams, ERD Software for Mac and Win
- Flowchart | Basic Flowchart Symbols and Meaning
- Flowchart | Flowchart Design - Symbols, Shapes, Stencils and Icons
- Flowchart | Flow Chart Symbols
- Electrical | Electrical Drawing - Wiring and Circuits Schematics
- Flowchart | Common Flowchart Symbols
- Flowchart | Common Flowchart Symbols