This exploded pie chart sample shows the economic sector weightings. It was designed on the base of the Wikimedia Commons file: Badpie.png [commons.wikimedia.org/ wiki/ File:Badpie.png].
This image is available under the Creative Commons Attribution-ShareAlike 3.0 Unported License [creativecommons.org/ licenses/ by-sa/ 3.0/ ].
"The classical breakdown of all economic sectors follows:
Primary: Involves the retrieval and production of raw materials, such as corn, coal, wood and iron. (A coal miner and a fisherman would be workers in the primary sector.)
Secondary: Involves the transformation of raw or intermediate materials into goods e.g. manufacturing steel into cars, or textiles into clothing. (A builder and a dressmaker would be workers in the secondary sector.)
Tertiary: Involves the supplying of services to consumers and businesses, such as baby-sitting, cinema and banking. (A shopkeeper and an accountant would be workers in the tertiary sector.)
In the 20th century, it began to be argued that traditional tertiary services could be further distinguished from "quaternary" and quinary service sectors." [Economic sector. Wikipedia]
The exploded pie chart example "Economic sector weightings" was created using the ConceptDraw PRO diagramming and vector drawing software extended with the Pie Charts solution of the Graphs and Charts area in ConceptDraw Solution Park.
Exploded pie chart

Use this circle chart template to design your sector diagrams.
"A chart is a graphical representation of data, in which the data is represented by symbols, such as ... slices in a pie chart. ... Charts are often used to ease understanding ... the relationships between parts of the data. ... For example, data that presents percentages in different groups (such as "satisfied, not satisfied, unsure") are often displayed in a pie chart ... A pie chart shows percentage values as a slice of a pie." [Chart. Wikipedia]
The template "Sector diagram" for the ConceptDraw PRO diagramming and vector drawing software is included in the Pie Charts solution of the Graphs and Charts area in ConceptDraw Solution Park.
Circle chart

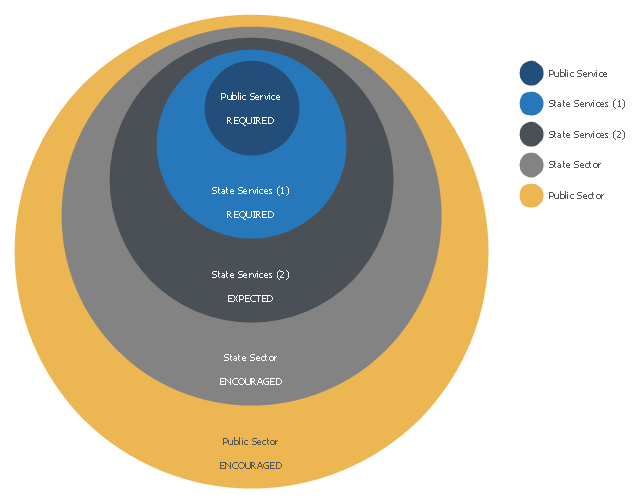
This onion diagram example was designed on the base of figure in the article "Public Sector Agencies" on the website "New Zealand Government Procurement"
[business.govt.nz/ procurement/ for-agencies/ key-guidance-for-agencies/ public-sector-agencies]
"Public sector organisations in New Zealand include the State sector plus the organisations of local government.
Within the State sector lies the State services, and within this, lies the core Public service." [Public sector organisations in New Zealand. Wikipedia]
The example "New Zealand Public Sector Agencies onion diagram" was drawn using the ConceptDraw PRO software extended with the Stakeholder Onion Diagrams solution from the Management area of ConceptDraw Solution Park.
Onion diagram example
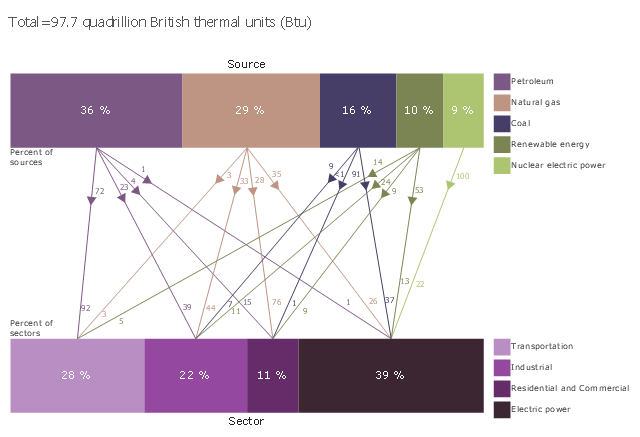
This divided bar diagram sample shows U.S. primary energy consumption by source and sector in 2015. It was designed using data from the chart in the webpage "U.S. Energy Facts Explained, Consumption & Production" on the website of the U.S. Energy Information Administration.
"Americans use many types of energy
Petroleum, natural gas, coal, renewable energy, and nuclear electric power are primary sources of energy. Electricity is a secondary energy source that is generated from primary sources of energy.
Energy sources are measured in different physical units: liquid fuels in barrels or gallons, natural gas in cubic feet, coal in short tons, and electricity in kilowatts and kilowatthours. In the United States, British thermal units (Btu), a measure of heat energy, is commonly used for comparing different types of energy to each other. In 2015, total U.S. primary energy consumption was about 97.7 quadrillion (1015, or one thousand trillion) Btu."
[eia.gov/ energyexplained/ index.cfm?page=us_ energy_ home]
The chart example "U.S. primary energy consumption by source and sector" was created using the ConceptDraw PRO diagramming and vector drawing software extended with the Divided Bar Diagrams solution from the Graphs and Charts area of ConceptDraw Solution Park.
Divided bar chart
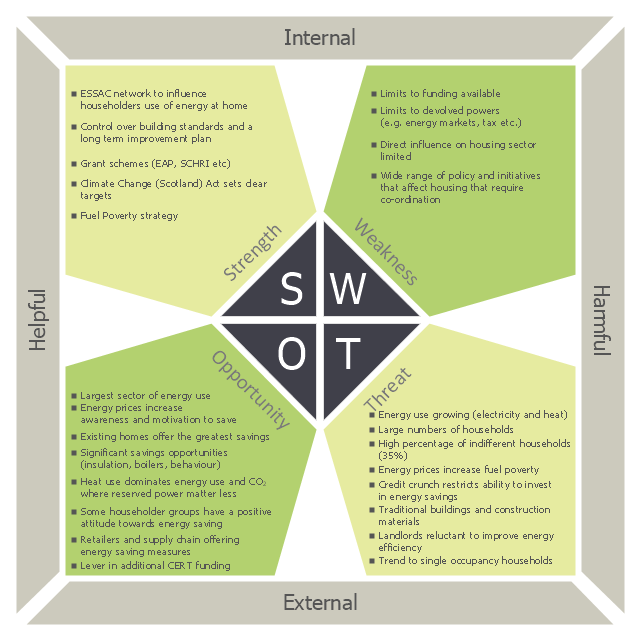
This sample was created on the base of the SWOT matrix illustrating the webpage "SWOT Analysis" of "Scottish Energy Study Volume 4: Issues, Opportunities and Barriers" from the website of the Scottish Government. [scotland.gov.uk/ Publications/ 2009/ 09/ 24094712/ 6]
The diagram example "Domestic sector SWOT" was created using the ConceptDraw PRO diagramming and vector drawing software extended with the SWOT Analysis solution from the Management area of ConceptDraw Solution Park.
The diagram example "Domestic sector SWOT" was created using the ConceptDraw PRO diagramming and vector drawing software extended with the SWOT Analysis solution from the Management area of ConceptDraw Solution Park.
SWOT matrix
Pie Chart Examples and Templates

Pie chart examples and templates created using ConceptDraw DIAGRAM software helps you get closer with pie charts and find pie chart examples suite your needs.
The vector stencils library "Plane geometry" contains 27 plane geometric figures.
Use these shapes to draw your geometrical diagrams and illustrations in the ConceptDraw PRO diagramming and vector drawing software extended with the Mathematics solution from the Science and Education area of ConceptDraw Solution Park.
Use these shapes to draw your geometrical diagrams and illustrations in the ConceptDraw PRO diagramming and vector drawing software extended with the Mathematics solution from the Science and Education area of ConceptDraw Solution Park.
Circular sector
Right triangle

Rectangle

Square

Pentagon

Isosceles trapezium

Parallelogram

Trapezium

Three-pointed star

Four-pointed star

Five-pointed star

Six-pointed star

Seven-pointed star

Eight-pointed star

Triangle

Equilateral triangle

Right triangle 2

Right triangle, angle box

Right triangle 3

Hexagon

Regular hexagon

Regular pentagon

Regular heptagon

Regular octagon

Rhombus

Circle

Ellipse

The vector stencils library "Sales arrows" contains 57 arrow symbols.
Use these arrow icon set to draw your sales flowcharts, workflow diagrams and process charts with the ConceptDraw PRO diagramming and vector drawing software.
The arrow pictograms library "Sales arrows" is included in the Sales Flowcharts solution from the Marketing area of ConceptDraw Solution Park.
Angle arrow
Arc arrow
Arki arrow
Arrow fork
Arrow loop
Bent arrow
Chevron arrow
Circular arrow
Circular motion arrows

Clockwise arrow
Corner arrow
Counterclockwise arrow
Crossed arrows

Curved left arrow
Curved right arrow
Curving directional arrow
Cycle arrow
Diagonal arrow
Double arc arrow
Double headed arrow
Double headed semicircle arrow
Down arrow
Dual short arc arrow
Elbow arrow
Fat arrow
Go back arrow
Interaction arrows

L-shaped arrow
Left arrow
Lightning arrow
Long arc arrow
Looping arrows

Merging arrows

Moving down arrow
Moving up arrow
Recycling arrows

Refresh arrows

Ribbon arrow
Right arrow
Rotating arrows

S-shaped arrow
Sector arrow
Semicircle arrow
Short arc arrow
Single headed arrow
Small arrow
Split arrow
Straight arrow
Triangle arrow
Turn left arrow
Turn right arrow
Turn round arrow
Turned arrow
Up arrow
U-shaped arrow
Vertical moving arrow
Wavy arrow
The vector stencils library "Education indicators" contains 12 graphic indicators.
Use these visual indicators to design your educational infogram.
The vector stencils library "Education indicators" is included in the Education Infographics solution from the Business Infographics area of ConceptDraw Solution Park.
Use these visual indicators to design your educational infogram.
The vector stencils library "Education indicators" is included in the Education Infographics solution from the Business Infographics area of ConceptDraw Solution Park.
1-Sector donut chart

2-Sectors donut chart

1-Sector pie chart

2-Sectors pie chart

2-Bars horizontal bar chart

2-Columns arrow chart
Bullet indicator

Progress bar

Radial gauge

Semi-radial gauge

Square chart 10x10 - filling from above

Stickman row pictograph

The vector stencils library "Management indicators" contains 14 visual indicators.
Use it to create your management infogram in the ConceptDraw PRO diagramming and vector drawing software.
The example "Management indicators - Vector stencils library" is included in the solution "Marketing infographics" from the "Business infographics" area of ConceptDraw Solution Park.
Use it to create your management infogram in the ConceptDraw PRO diagramming and vector drawing software.
The example "Management indicators - Vector stencils library" is included in the solution "Marketing infographics" from the "Business infographics" area of ConceptDraw Solution Park.
1-Sector donut chart

1-Sector pie chart

2-Bars horizontal bar chart

2-Columns arrow chart
2-Columns arrow chart 2
2-Sectors donut chart

2-Sectors pie chart

Bullet indicator

Progress bar

Radial gauge

Semi-radial gauge

Square chart 10x10 - filling from above

Square chart 10x10 - filling from below

Stickman row pictograph

The vector stencils library "Management indicators" contains 14 visual indicators.
Use it to create your management infogram in the ConceptDraw PRO diagramming and vector drawing software.
The example "Management indicators - Vector stencils library" is included in the solution "Marketing infographics" from the "Business infographics" area of ConceptDraw Solution Park.
Use it to create your management infogram in the ConceptDraw PRO diagramming and vector drawing software.
The example "Management indicators - Vector stencils library" is included in the solution "Marketing infographics" from the "Business infographics" area of ConceptDraw Solution Park.
1-Sector donut chart
1-Sector pie chart
2-Bars horizontal bar chart
2-Columns arrow chart
2-Columns arrow chart 2
2-Sectors donut chart
2-Sectors pie chart
Bullet indicator
Progress bar
Radial gauge
Semi-radial gauge
Square chart 10x10 - filling from above
Square chart 10x10 - filling from below
Stickman row pictograph
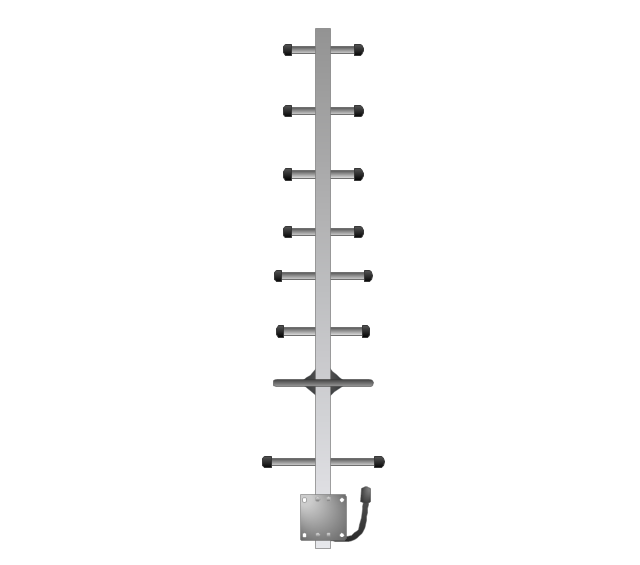
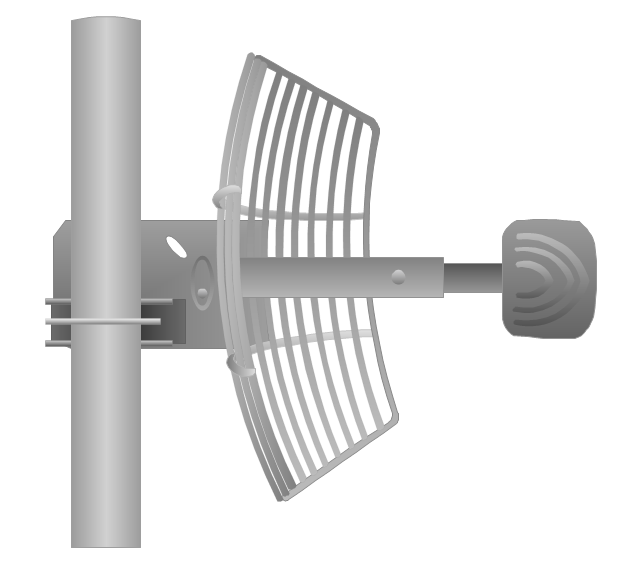
The vector stencils library "Telecom equipment" contains 11 hardware clipart icons of telecommunication devices for drawing computer network diagrams and equipment layouts.
"In telecommunication, a communications system is a collection of individual communications networks, transmission systems, relay stations, tributary stations, and data terminal equipment (DTE) usually capable of interconnection and interoperation to form an integrated whole. The components of a communications system serve a common purpose, are technically compatible, use common procedures, respond to controls, and operate in union. Telecommunications is a method of communication." [Communications system. Wikipedia]
"A basic telecommunication system consists of three primary units that are always present in some form: (1) A transmitter that takes information and converts it to a signal. (2) A transmission medium, also called the "physical channel" that carries the signal. ... (3) A receiver that takes the signal from the channel and converts it back into usable information." [Telecommunication. Wikipedia]
The clip art example "Telecom equipment - Vector stencils library" was created using the ConceptDraw PRO diagramming and vector drawing software extended with the Telecommunication Network Diagrams solution from the Computer and Networks area of ConceptDraw Solution Park.
Andrew multiband high / low power splitter

Andrew multi-band indoor omnidirectional antenna

Panel sector directional antenna

Omni directional antenna

Yagi directional antenna
Yagi integrated downconverter

Grid antenna
Loop antenna

FireTide HotPort® 6000 wireless mesh nodes
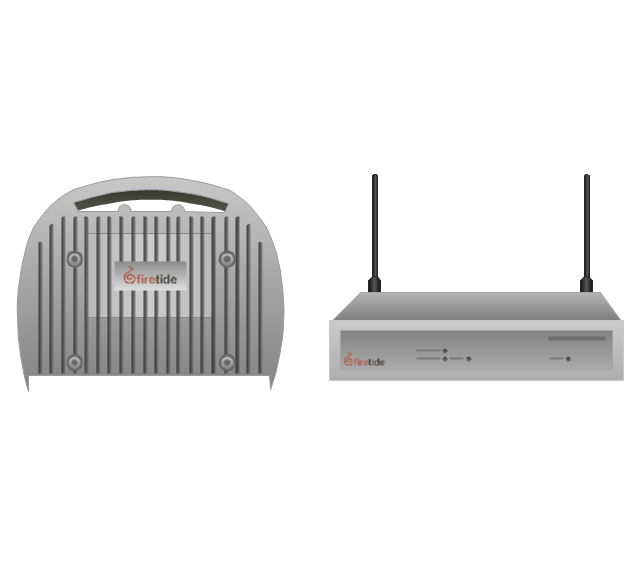
FireTide HotPoint® wireless access point

FireTide HotClient Customer Premises Equipment (CPE)
-telecom-equipment---vector-stencils-library.png--diagram-flowchart-example.png)
The vector stencils library "Management indicators" contains 14 visual indicators.
Use it to create your management infogram in the ConceptDraw PRO diagramming and vector drawing software.
The example "Management indicators - Vector stencils library" is included in the solution "Marketing infographics" from the "Business infographics" area of ConceptDraw Solution Park.
Use it to create your management infogram in the ConceptDraw PRO diagramming and vector drawing software.
The example "Management indicators - Vector stencils library" is included in the solution "Marketing infographics" from the "Business infographics" area of ConceptDraw Solution Park.
1-Sector donut chart
1-Sector pie chart
2-Bars horizontal bar chart
2-Columns arrow chart
2-Columns arrow chart 2
2-Sectors donut chart
2-Sectors pie chart
Bullet indicator
Progress bar
Radial gauge
Semi-radial gauge
Square chart 10x10 - filling from above
Square chart 10x10 - filling from below
Stickman row pictograph
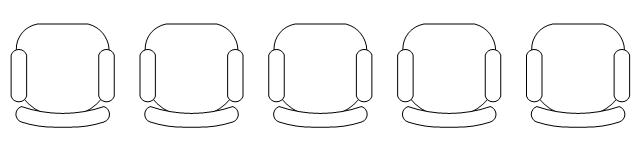
The vector stencils library "Seat blocks" contains 18 symbols of seat blocks and grandstands. Use it for drawing seating plans and furniture layouts in the ConceptDraw PRO diagramming and vector drawing software extended with the Seating Plans solution from the Building Plans area of ConceptDraw Solution Park.
Stage

Chair

Stage 1

Chair block 1

Chair block 2
Border

Entrance 1

Gangway

Balcony

Sector 1

Sector 2

Sector 3

Sector 4

Sector 5

Sector 6

Stair 1

Stair 2

Stair 3

The vector stencils library "Plane geometry" contains 27 plane geometric figures.
Use these shapes to draw your geometrical diagrams and illustrations in the ConceptDraw PRO diagramming and vector drawing software extended with the Mathematics solution from the Science and Education area of ConceptDraw Solution Park.
Use these shapes to draw your geometrical diagrams and illustrations in the ConceptDraw PRO diagramming and vector drawing software extended with the Mathematics solution from the Science and Education area of ConceptDraw Solution Park.
Circular sector
Right triangle
Rectangle
Square
Pentagon
Isosceles trapezium
Parallelogram
Trapezium
Three-pointed star
Four-pointed star
Five-pointed star
Six-pointed star
Seven-pointed star
Eight-pointed star
Triangle
Equilateral triangle
Right triangle 2
Right triangle, angle box
Right triangle 3
Hexagon
Regular hexagon
Regular pentagon
Regular heptagon
Regular octagon
Rhombus
Circle
Ellipse
The vector stencils library "Seat blocks" contains 18 symbols of seat blocks and grandstands. Use it for drawing seating plans and furniture layouts in the ConceptDraw PRO diagramming and vector drawing software extended with the Seating Plans solution from the Building Plans area of ConceptDraw Solution Park.
Stage
Chair
Stage 1
Chair block 1
Chair block 2
Border
Entrance 1
Gangway
Balcony
Sector 1
Sector 2
Sector 3
Sector 4
Sector 5
Sector 6
Stair 1
Stair 2
Stair 3
The vector stencils library "Education indicators" contains 12 graphic indicators.
Use these visual indicators to design your educational infogram.
The vector stencils library "Education indicators" is included in the Education Infographics solution from the Business Infographics area of ConceptDraw Solution Park.
Use these visual indicators to design your educational infogram.
The vector stencils library "Education indicators" is included in the Education Infographics solution from the Business Infographics area of ConceptDraw Solution Park.
1-Sector donut chart
2-Sectors donut chart
1-Sector pie chart
2-Sectors pie chart
2-Bars horizontal bar chart
2-Columns arrow chart
Bullet indicator
Progress bar
Radial gauge
Semi-radial gauge
Square chart 10x10 - filling from above
Stickman row pictograph
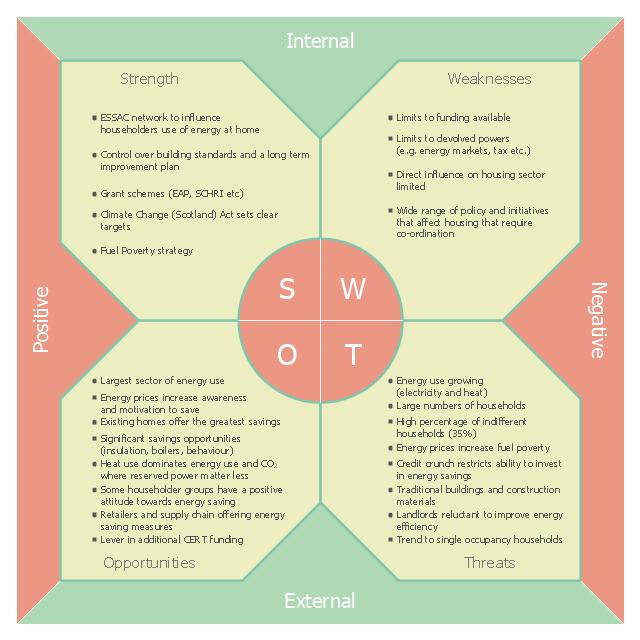
This SWOT analysis diagram sample was created on the base of the webpage "3 SWOT Analysis" of the "Scottish Energy Study Volume 4: Issues, Opportunities and Barriers" from the website of the Scottish Government. [scotland.gov.uk/ Publications/ 2009/ 09/ 24094712/ 6]
The SWOT matrix example "Scottish Government strategy to reduce the energy and CO2 emissions from the Domestic Sector in Scotland" was created using the ConceptDraw PRO diagramming and vector drawing software extended with the SWOT Analysis solution from the Management area of ConceptDraw Solution Park.
The SWOT matrix example "Scottish Government strategy to reduce the energy and CO2 emissions from the Domestic Sector in Scotland" was created using the ConceptDraw PRO diagramming and vector drawing software extended with the SWOT Analysis solution from the Management area of ConceptDraw Solution Park.
SWOT matrix
This step chart sample shows engineering value chain. It was designed on the base of the Wikimedia Commons file: The engineering value chain.png. "The engineering value chain (EVC) refers to a series of engineering activities and capabilities contributing to value creation encompassing essential elements such as idea generation & selection, design & development, production & delivery, service & support, and disposal & recycling for example." [commons.wikimedia.org/ wiki/ File:The_ engineering_ value_ chain.png]
This file is licensed under the Creative Commons Attribution-Share Alike 3.0 Unported license. [creativecommons.org/ licenses/ by-sa/ 3.0/ deed.en]
The diagram example "Step chart - Value chain" was created using the ConceptDraw PRO diagramming and vector drawing software extended with the Marketing Diagrams solution from the Marketing area of ConceptDraw Solution Park.
Marketing diagram

- Chart Examples | Pie Chart Examples and Templates | Business ...
- Economic sector weightings | Room Planning Software | Porter's ...
- Stakeholder Onion Diagrams | Flow Chart Of The Primary Sector ...
- Draw A Flow Chart To Show The Primary Sector Of Any Good The
- Sector diagram - Template | New Zealand Public Sector Agencies ...
- How To use House Electrical Plan Software | Economic sector ...
- Sector weightings - Exploded pie chart | Chart Templates | Pie Chart ...
- Economic sector weightings | Primary Secondary And Tertiary ...
- Divided Bar Diagrams | Pictures For Primary Sector For Drawing
- Primary Sector Secondary Sector And Tertiary Sector Flow Diagram
- Economic sector weightings | Bar Diagrams for Problem Solving ...
- Sector diagram - Template | Economic sector weightings | New ...
- Economic sector weightings | Secondary Sector Pie Chart
- Economic sector weightings | Pie Chart Examples and Templates ...
- Design A Picture Of Primary Sector
- Draw Your Own Diagram And Explain The Activities In Each Sector
- Draw Primary Sector
- Divided Bar Diagrams | Primary Sector Pictures Easy To Draw
- Sector weightings - Exploded pie chart
- Sector diagram - Template | Basic Circle-Spoke Diagrams | Porter ...
- ERD | Entity Relationship Diagrams, ERD Software for Mac and Win
- Flowchart | Basic Flowchart Symbols and Meaning
- Flowchart | Flowchart Design - Symbols, Shapes, Stencils and Icons
- Flowchart | Flow Chart Symbols
- Electrical | Electrical Drawing - Wiring and Circuits Schematics
- Flowchart | Common Flowchart Symbols
- Flowchart | Common Flowchart Symbols