 Block Diagrams
Block diagrams solution extends ConceptDraw PRO software with templates, samples and libraries of vector stencils for drawing the block diagrams.
Basic Flowchart Symbols and Meaning


 ConceptDraw Solution Park
ConceptDraw Solution Park collects graphic extensions, examples and learning materials
Process Flowchart


 Total Quality Management TQM Diagrams
Total Quality Management Diagrams solution extends ConceptDraw PRO software with samples, templates and vector stencils library for drawing the TQM flowcharts.
Basic Diagramming

Use Basic Diagramming solution to draw you own diagrams, charts and graphs for graphic communication, explanation of business and personal ideas and concepts, simple visual presentation of numerical data, complex structures, logical relations, step-by-step flows of actions or operations.

Business Diagram Software


Create Block Diagram

Create block diagrams, electrical circuit diagrams, schematics, and more in minutes with ConceptDraw PRO.
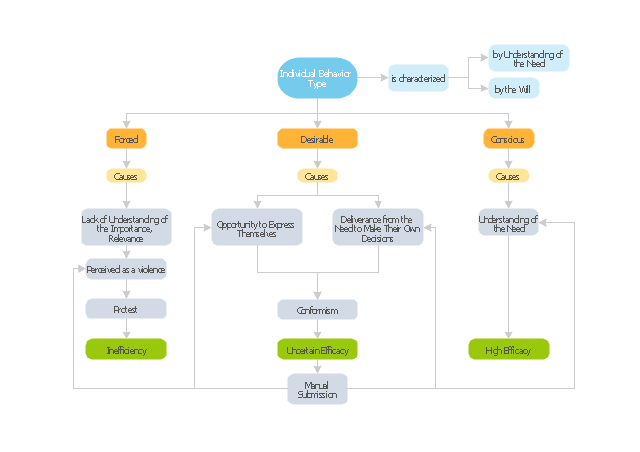
"Organizational behavior is a field of study that investigates the impact that individuals, groups and structures have on behavior within an organization for the purpose of applying such knowledge towards improving an organization's effectiveness. It is an interdisciplinary field that includes sociology, psychology, communication, and management; and it complements the academic studies of organizational theory (which is focused on organizational and intra-organizational topics) and human resource studies (which is more applied and business-oriented). It may also be referred to as organizational studies or organizational science." [Organizational behavior. Wikipedia]
The block diagram example "Types of individual behavior in organization" was created using the ConceptDraw PRO diagramming and vector drawing software extended with the Block Diagrams solution from the area "What is a Diagram" of ConceptDraw Solution Park.
The block diagram example "Types of individual behavior in organization" was created using the ConceptDraw PRO diagramming and vector drawing software extended with the Block Diagrams solution from the area "What is a Diagram" of ConceptDraw Solution Park.
Block diagram
Venn Diagram Examples for Problem Solving. Computer Science. Chomsky Hierarchy

The Venn diagram example below visualizes the the class of language inclusions described by the Chomsky hierarchy.
 Telecommunication Network Diagrams
Telecommunication Network Diagrams solution extends ConceptDraw PRO software with samples, templates, and great collection of vector stencils to help the specialists in a field of networks and telecommunications, as well as other users to create Computer systems networking and Telecommunication network diagrams for various fields, to organize the work of call centers, to design the GPRS networks and GPS navigational systems, mobile, satellite and hybrid communication networks, to construct the mobile TV networks and wireless broadband networks.
 Fishbone Diagrams
The Fishbone Diagrams solution extends ConceptDraw PRO v10 software with the ability to easily draw the Fishbone Diagrams (Ishikawa Diagrams) to clearly see the cause and effect analysis and also problem solving. The vector graphic diagrams produced using this solution can be used in whitepapers, presentations, datasheets, posters, and published technical material.
 SYSML
SYSML
The SysML solution helps to present diagrams using Systems Modeling Language; a perfect tool for system engineering.
- Simple Block Diagram Of Scientific Management
- Block Diagram Of Function Organization Management
- Block Diagram Of Project Management
- Block Diagram Of Management Function
- Block Diagram In Management And Planning
- Block diagram - Document management system architecture | Block ...
- Block Diagram | Process Flowchart | Functional Block Diagram ...
- Diagram Of Management Functions
- Total Quality Management Value | TQM Diagram Tool | Seven ...
- Total Quality Management Value | TQM Diagram Tool | Pyramid ...
- Block diagram - Document management system architecture | Block ...
- Block diagram - Document management system architecture
- Decision Making | Block diagram - Customer decision making ...
- Block Diagram Of Computer Examples
- Block diagram - Document management system architecture | Block ...
- Block diagram - Total solution process | Process Flowchart ...
- Venn Diagram Examples for Problem Solving. Computer Science ...
- Total Quality Management TQM Diagrams | Block Diagram Creator ...
- Basic Diagramming | Venn Diagram Examples for Problem Solving ...
- Structure Of Organization With Block Diagram
- ERD | Entity Relationship Diagrams, ERD Software for Mac and Win
- Flowchart | Basic Flowchart Symbols and Meaning
- Flowchart | Flowchart Design - Symbols, Shapes, Stencils and Icons
- Flowchart | Flow Chart Symbols
- Electrical | Electrical Drawing - Wiring and Circuits Schematics
- Flowchart | Common Flowchart Symbols
- Flowchart | Common Flowchart Symbols