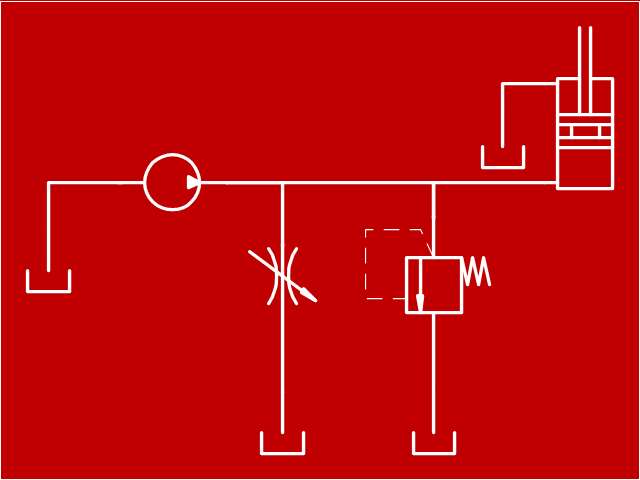
"Hydraulics is a topic in applied science and engineering dealing with the mechanical properties of liquids. At a very basic level hydraulics is the liquid version of pneumatics. Fluid mechanics provides the theoretical foundation for hydraulics, which focuses on the engineering uses of fluid properties. In fluid power, hydraulics is used for the generation, control, and transmission of power by the use of pressurized liquids. Hydraulic topics range through some part of science and most of engineering modules, and cover concepts such as pipe flow, dam design, fluidics and fluid control circuitry, pumps, turbines, hydropower, computational fluid dynamics, flow measurement, river channel behavior and erosion." [Hydraulics. Wikipedia]
This hydraulic schematic example was redrawn using ConceptDraw PRO diagramming and vector drawing software from the Wikimedia Commons file: Skjematikk.GIF.
[commons.wikimedia.org/ wiki/ File:Skjematikk.GIF]
This file is licensed under the Creative Commons Attribution-Share Alike 3.0 Unported license.
[creativecommons.org/ licenses/ by-sa/ 3.0/ deed.en]
The engineering drawing example "Hydraulic schematic" was created using the ConceptDraw PRO diagramming and vector drawing software extended with the Mechanical Engineering solution from the Engineering area of ConceptDraw Solution Park.
Hydraulic schematic example
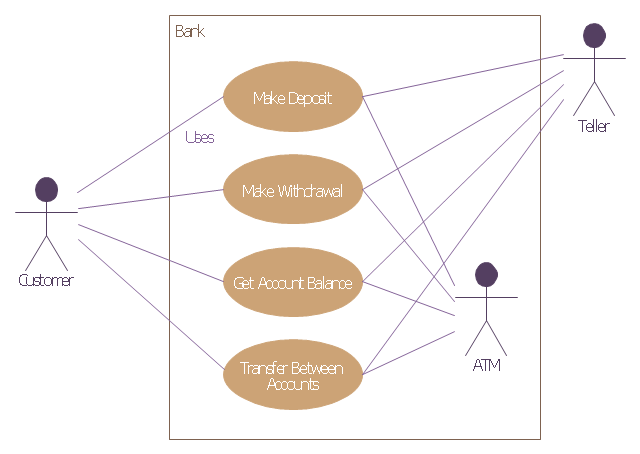
This example of bank ATM UML activity diagram was created on the base of UML use case diagram of automated teller machine from the course "Thinking in Java, 2nd edition, Revision 9" by Bruce Eckel published on the website of the Computer Science and Electrical Engineering Department of the University of Maryland, Baltimore (UMBC).
"If you are designing an auto-teller, for example, the use case for a particular aspect of the functionality of the system is able to describe what the auto-teller does in every possible situation. Each of these “situations” is referred to as a scenario, and a use case can be considered a collection of scenarios. You can think of a scenario as a question that starts with: “What does the system do if...?” For example, “What does the auto-teller do if a customer has just deposited a check within the last 24 hours, and there’s not enough in the account without the check having cleared to provide a desired withdrawal?”
Use case diagrams are intentionally simple to prevent you from getting bogged down in system implementation details prematurely...
Each stick person represents an “actor,” which is typically a human or some other kind of free agent. (These can even be other computer systems, as is the case with “ATM.”) The box represents the boundary of your system. The ellipses represent the use cases, which are descriptions of valuable work that can be performed with the system. The lines between the actors and the use cases represent the interactions.
It doesn’t matter how the system is actually implemented, as long as it looks like this to the user."
[csee.umbc.edu/ courses/ 331/ resources/ tij/ text/ TIJ213.gif]
This automated teller machine (ATM) UML use case diagram example was created using the ConceptDraw PRO diagramming and vector drawing software extended with the ATM UML Diagrams solution from the Software Development area of ConceptDraw Solution Park.
Bank ATM UML sequence diagram
This astronomy diagram sample was redesignrd from the Wikimedia Commons file: Phases of the moon.gif. [commons.wikimedia.org/ wiki/ File:Phases_ of_ the_ moon.gif]
This file is licensed under the Creative Commons Attribution-Share Alike 3.0 Unported license. [creativecommons.org/ licenses/ by-sa/ 3.0/ deed.en]
"The lunar phase or phase of the moon is the shape of the illuminated (sunlit) portion of the Moon as seen by an observer, usually on Earth. The lunar phases change cyclically as the Moon orbits the Earth, according to the changing relative positions of the Earth, Moon, and Sun. The moon and the Earth are tidally locked, and therefore the same lunar surface always faces Earth. This face is variously sunlit depending on the position of the moon in its orbit. Ergo, the portion of this hemisphere that is visible to an observer on Earth can vary from about 100% (full moon) to 0% (new moon). The lunar terminator is the boundary between the illuminated and darkened hemispheres. Aside from some craters near the lunar poles such as Shoemaker, all parts of the Moon see around 14.77 days of sunlight followed by 14.77 days of "night" (the "dark side" of the Moon is a reference to radio darkness, not visible light darkness).
The four principal lunar phases are first quarter, full moon, third quarter, and new moon (third quarter moon is also known as last quarter moon.) Each of the four lunar phases is roughly 7 days (~7.4 days) each, but varies slightly due to lunar apogee and perigee." [Lunar phase. Wikipedia]
The astronomical diagram example "Phases of the moon" was created using the ConceptDraw PRO diagramming and vector drawing software extended with the Astronomy solution from the Science and Education area of ConceptDraw Solution Park.
Lunar phases

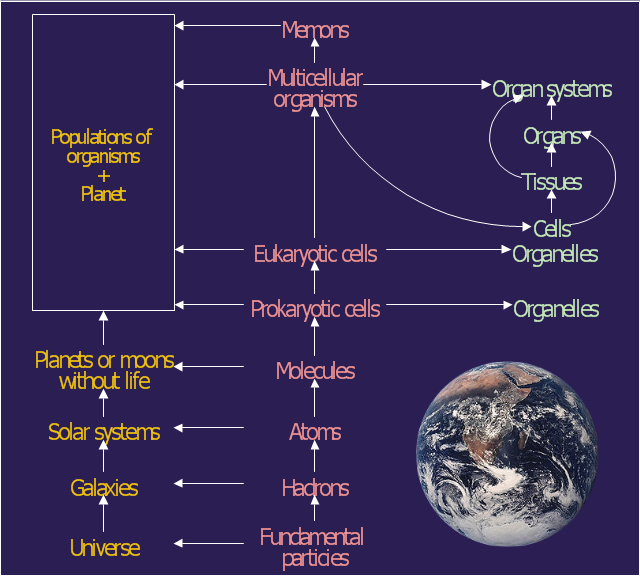
This diagram example was redesigned from the Wikimedia Commons file: Operator hierarchy - natural hierarchy rearranged.gif.
The diagram shows rearrangement of the classical ecological/ system hierarchy. From left to right the columns represent interaction systems, operators and internal differentiations (Gerard Jagers op Akkerhuis).
The diagram was published at page 249 of Jagers op Akkerhuis, G.A.J.M. (2010). The operator hierarchy: a chain of closures linking matter, life and artificial intelligence. PhD thesis Radboud university Nijmegen, the Netherlands: 286 pp.
[commons.wikimedia.org/ wiki/ File:Operator_ hierarchy_ -_ natural_ hierarchy_ rearranged.gif]
The astronomic diagram example "Operator hierarchy - Natural hierarchy rearranged" was created using the ConceptDraw PRO diagramming and vector drawing software extended with the Astronomy solution from the Science and Education area of ConceptDraw Solution Park.
Rearrangement of the classical ecological/system hierarchy
 Health Sciences
Health Sciences solution including professionally designed samples and wide range of high-quality vector icons and pictograms of basic medical sciences, surgery specializations, internal medicine, medical diagnostics, interdisciplinary fields, mental health, obstetrics and gynecology, public health, allied health, and other medical specialties, is a perfect assistant in drawing Health diagrams, schematics, illustrations, infographics and slides for presentations on the healthcare, medical and health sciences thematic, in development knowledge in health science, in studying and representing the physical, mental and social aspects of human health, in determining the role of different health sciences at this process, finding and explaining new methods of treatment different diseases, making an overview and describing the main characteristics of health sciences in a visual form.
Health Science
HelpDesk
How to a Draw Biology Diagram

HelpDesk
How to Draw Physics Diagrams

- Mathematical Diagrams | Mathematics Symbols | Mathematics ...
- Operator hierarchy - Natural hierarchy rearranged | Astronomy ...
- Butt weld geometry | Mathematics Symbols | Mathematical Diagrams ...
- Physics | Biology | Language Learning | Science Solution Examples
- Operator hierarchy - Natural hierarchy rearranged | Venn Diagram ...
- Hydraulic schematic | Basics Hydraulic Schematic Of A Hydraulic ...
- Proton-proton chain reaction diagram | Operator hierarchy - Natural ...
- Hydraulic schematic | Example Of Pneumatic And Fluidic Drawing
- Hydraulic 5-ported 3-position valve template - Win | Hydraulic ...
- Butt weld geometry | Polygon types | Mathematics | Types Of ...
- ERD | Entity Relationship Diagrams, ERD Software for Mac and Win
- Flowchart | Basic Flowchart Symbols and Meaning
- Flowchart | Flowchart Design - Symbols, Shapes, Stencils and Icons
- Flowchart | Flow Chart Symbols
- Electrical | Electrical Drawing - Wiring and Circuits Schematics
- Flowchart | Common Flowchart Symbols
- Flowchart | Common Flowchart Symbols