 Block Diagrams
Block diagrams solution extends ConceptDraw DIAGRAM software with templates, samples and libraries of vector stencils for drawing the block diagrams.
Example of DFD for Online Store (Data Flow Diagram)

Example of DFD for Online Store shows the Data Flow Diagram for online store and interactions between the Visitors, Customers and Sellers, as well as Website Information and User databases.

 Data Flow Diagrams (DFD)
Data Flow Diagrams solution extends ConceptDraw DIAGRAM software with templates, samples and libraries of vector stencils for drawing the data flow diagrams (DFD).
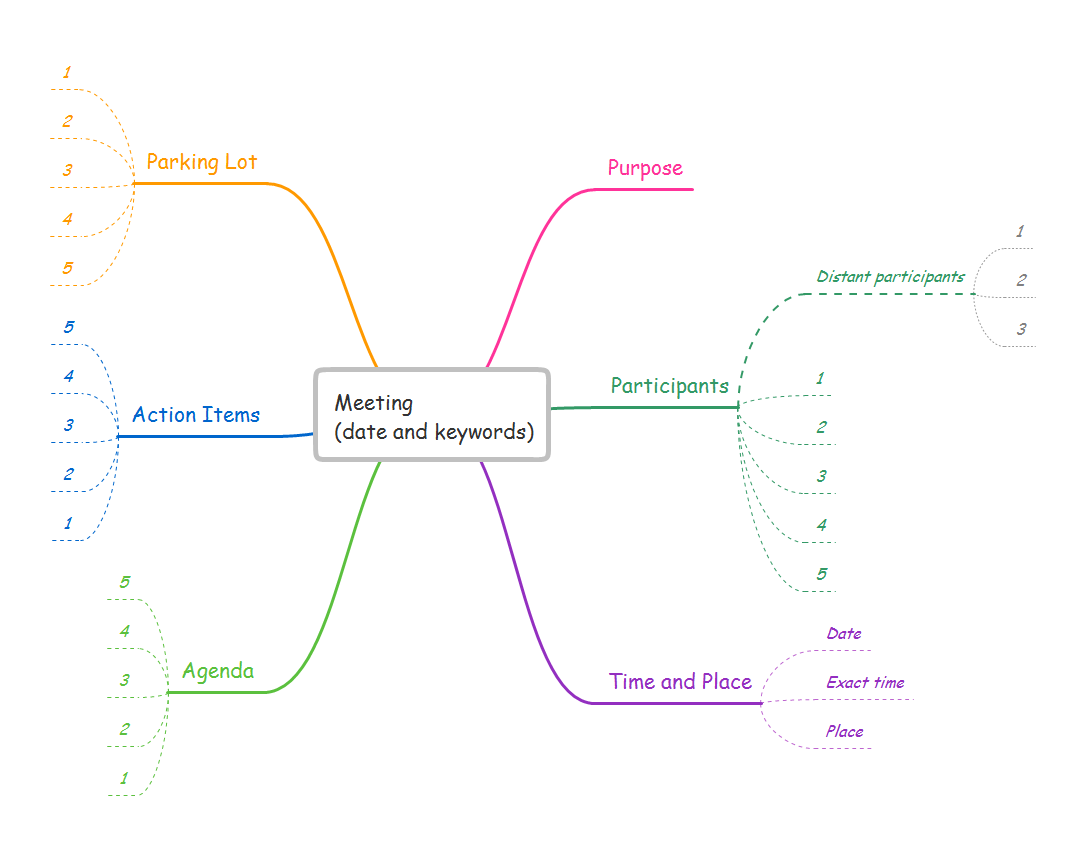
A Tool for EffectiveTeam Meetings

Local area network (LAN). Computer and Network Examples
 diagram")
ConceptDraw - Perfect Network Diagramming Software with examples of LAN Diagrams. ConceptDraw Network Diagram is ideal for network engineers and network designers who need to draw Local Area Network diagrams.

 Fishbone Diagrams
The Fishbone Diagrams solution extends ConceptDraw DIAGRAM software with the ability to easily draw the Fishbone Diagrams (Ishikawa Diagrams) to clearly see the cause and effect analysis and also problem solving. The vector graphic diagrams produced using this solution can be used in whitepapers, presentations, datasheets, posters, and published technical material.
Structured Systems Analysis and Design Method (SSADM) with ConceptDraw DIAGRAM

How to Create Flowcharts for an Accounting Information System

Flowcharts help users of Accounting Information System to understand the step sequences of accounting processes. Use ConceptDraw DIAGRAM with Accounting Flowcharts solution to document and communicate visually how accounting processes work, and how each operation is done.
Basic Flowchart Symbols and Meaning


 Crow's Foot Notation
Crow’s Foot Notation solution extends ConceptDraw DIAGRAM software with powerful drawing tools, samples and library of predesigned vector Crow's Foot notation icons to help you easy describe the databases using the Entity-Relationship models and design professional-looking ER diagrams based on the popular Crow's Foot notation.
- School Management System Presentation
- School Management System Block Diagram
- School Management System Analysis
- Schema And Er Diagram For School Management System
- Dfd Example For School Management System
- System Analysis And Design For School Management System
- School Management System ER Diagram
- ER Diagram Of School Management System Pdf
- Er Diagram For College Management System Ppt
- Dfd For School Management System Pdf
- ERD | Entity Relationship Diagrams, ERD Software for Mac and Win
- Flowchart | Basic Flowchart Symbols and Meaning
- Flowchart | Flowchart Design - Symbols, Shapes, Stencils and Icons
- Flowchart | Flow Chart Symbols
- Electrical | Electrical Drawing - Wiring and Circuits Schematics
- Flowchart | Common Flowchart Symbols
- Flowchart | Common Flowchart Symbols