CORRECTIVE ACTIONS PLANNING. PERT Chart

ConceptDraw Office suite is a software for corrective actions planning.

Activity Network (PERT) Chart

This diagram is constructed as part of the process in creating a schedule of corrective actions. The Activity Network Chart (PERT) shows the logical connections and consequence of tasks to be performed. It displays the time period for problem solving and the implementation of all activities through the critical path.
Network Diagram Software Topology Network

Program Evaluation and Review Technique (PERT) with ConceptDraw DIAGRAM

Activity on Node Network Diagramming Tool

This sample shows the Activity on node network diagramming method. It was created in ConceptDraw DIAGRAM diagramming and vector drawing software using the Seven Management and Planning Tools solution from the Management area of ConceptDraw Solution Park.
Activity Network Diagram Method

This sample shows the PERT (Program Evaluation Review Technique) chart of the request on proposal. A request for proposal (RFP) is a request of the company or the organization to potential suppliers to submit the business proposals for service or goods that it is interested to purchase. The RFP is represented on the initial procurement stage and allows to define the risks and benefits.
How to Discover Critical Path on a Gantt Chart

Project Timeline

You need to make professional looking project timeline? Create it with ConceptDraw DIAGRAM! ConceptDraw DIAGRAM extended with Timeline Diagrams Solution from the Management Area is the best timeline diagrams software
Gantt charts for planning and scheduling projects

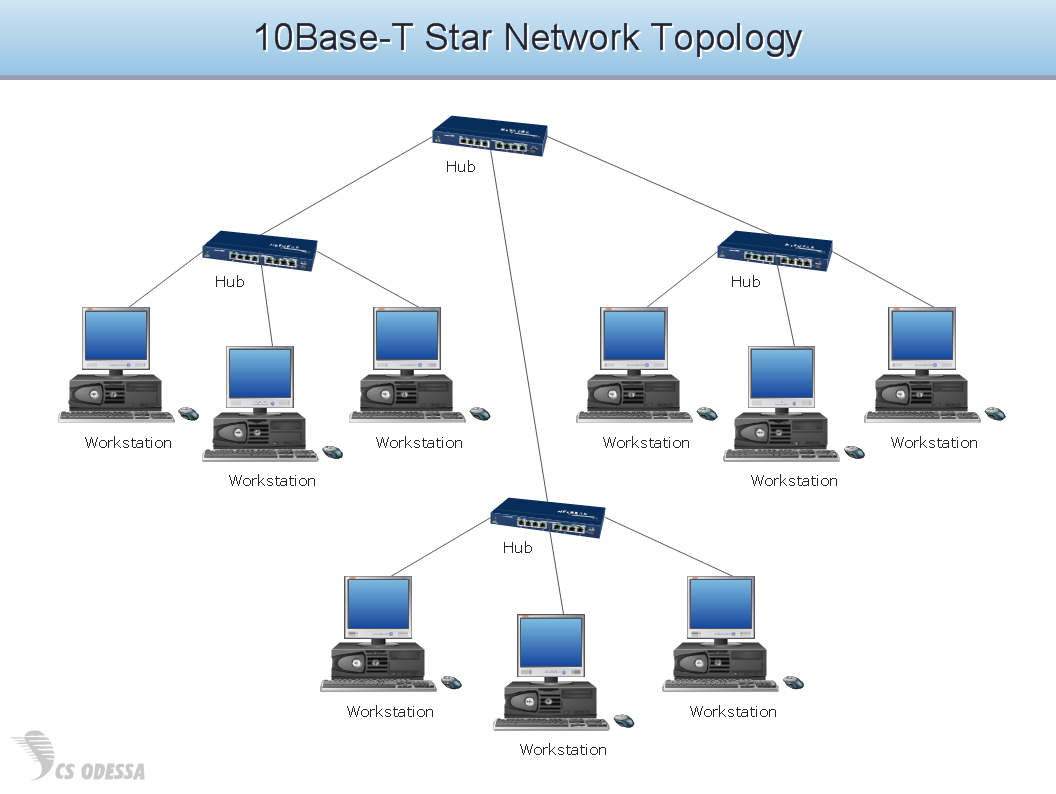
 Network Layout Floor Plans
Network Layout Floor Plans solution extends ConceptDraw DIAGRAM software functionality with powerful tools for quick and efficient documentation the network equipment and displaying its location on the professionally designed Network Layout Floor Plans. Never before creation of Network Layout Floor Plans, Network Communication Plans, Network Topologies Plans and Network Topology Maps was not so easy, convenient and fast as with predesigned templates, samples, examples and comprehensive set of vector design elements included to the Network Layout Floor Plans solution. All listed types of plans will be a good support for the future correct cabling and installation of network equipment.
- Warehouse Schedule Network Diagram Sample
- Gantt charts for planning and scheduling projects | Network Diagram ...
- A Task Network Diagram In Soft Project Management
- Software development with ConceptDraw PRO | Daily Schedule ...
- Computer Network Diagrams | Electrical Layout Plan With Schedule ...
- IDEF1X Standard | Computer Network Diagrams | Network ...
- How To Create a PERT Chart | Network Diagramming Software for ...
- Chart On Project Proposal
- Gant Chart in Project Management | Gantt charts for planning and ...
- Project Schedule Timeline Wireless Networks
- ERD | Entity Relationship Diagrams, ERD Software for Mac and Win
- Flowchart | Basic Flowchart Symbols and Meaning
- Flowchart | Flowchart Design - Symbols, Shapes, Stencils and Icons
- Flowchart | Flow Chart Symbols
- Electrical | Electrical Drawing - Wiring and Circuits Schematics
- Flowchart | Common Flowchart Symbols
- Flowchart | Common Flowchart Symbols