Scatter Chart Analysis. Scatter Chart Example
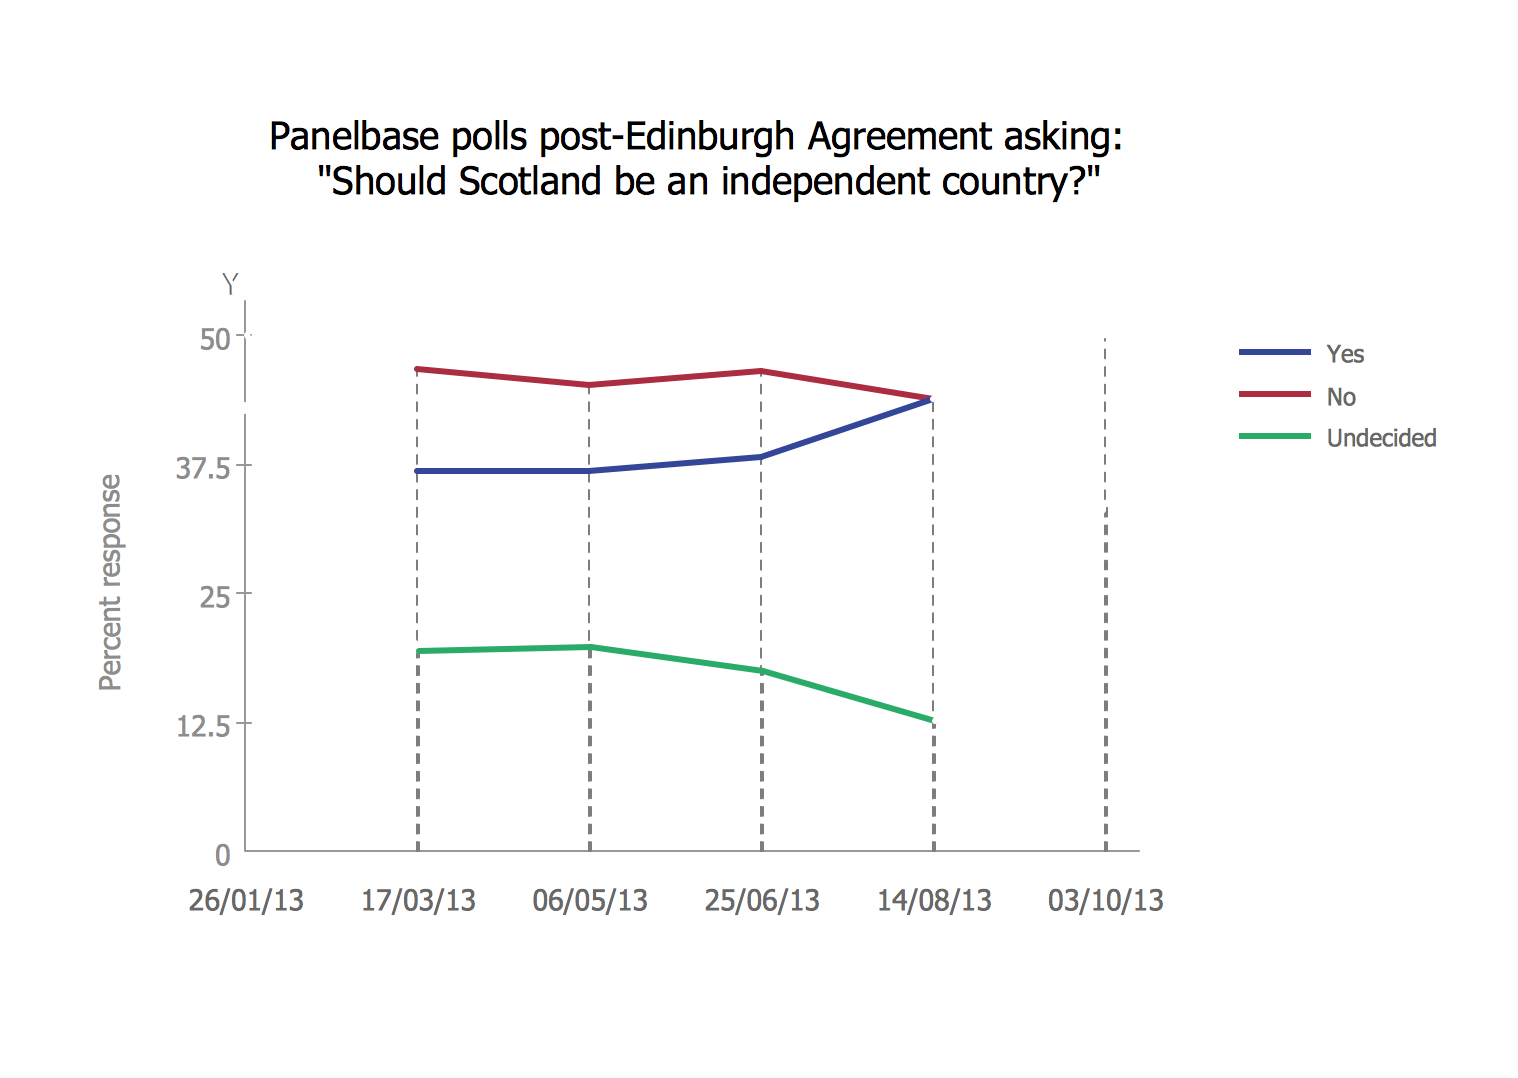
Scatter Diagram
Using the ready-to-use objects from the Line Graphs Solution for ConceptDraw DIAGRAM you can create your own professional looking Scatter Charts quick and easy.
Chart Templates

 Scatter Diagrams
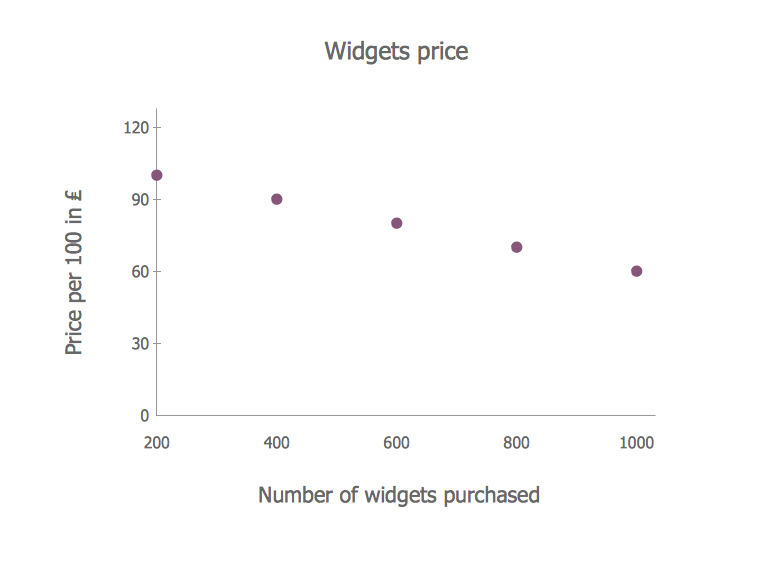
The Scatter Diagrams solution extends ConceptDraw DIAGRAM functionality with templates, samples, and a library of vector stencils that make construction of a Scatter Plot easy. The Scatter Chart Solution makes it easy to design attractive Scatter Diagrams used in various fields of science, work, and life activities. ConceptDraw DIAGRAM lets you enter the data to the table and construct the Scatter Plot Graph automatically according to these data.
Blank Scatter Plot
Chart Examples

Chart Software for Better Presentations

Graphs and Charts Area provide a wide collection of professional looking predesigned templates, samples and ready-to-use vector stencils that will help you to draw the charts and diagrams of various types: Pie Charts, Donut Charts, Line Charts, Column Charts, Bar Charts, Pyramids, Scatter Charts, Venn Diagrams, Spider Charts, Area Charts, Divided Bar Graphs.
 Basic Scatter Diagrams
This solution extends ConceptDraw DIAGRAM (or later) with templates, samples and a library of vector stencils for drawing Scatter Diagrams.
Flowchart Example: Flow Chart of Marketing Analysis

Basic Flowchart Images. Flowchart Examples

This sample shows the Flowchart that displays the procedures of 2PP (two-party preferred) voting and counting the voters. The two-party-preferred vote is the result of the elections that was distributed to the final two parties.
- Sample Pictorial Chart . Sample Infographics | Picture Graphs ...
- Line Chart Template for Word | Sales Growth. Bar Graphs Example ...
- Marketing Analysis Diagram | Flowchart Example : Flow Chart of ...
- Normal distribution graph - Template | Double bar graph - Template ...
- Plot Of Scattered Diagram In Managerial Economics
- Picture Graphs | Pie Chart Word Template. Pie Chart Examples | Bar ...
- Make a Scatter Plot | Scatter Plot Graph | Scatter Chart Examples ...
- Line Graph | Line Chart Examples | Basic Diagramming | Line Graph ...
- Product life cycle graph | Product life cycle graph - Template | Scatter ...
- Pie Graph Worksheets | Business Report Pie. Pie Chart Examples ...
- ERD | Entity Relationship Diagrams, ERD Software for Mac and Win
- Flowchart | Basic Flowchart Symbols and Meaning
- Flowchart | Flowchart Design - Symbols, Shapes, Stencils and Icons
- Flowchart | Flow Chart Symbols
- Electrical | Electrical Drawing - Wiring and Circuits Schematics
- Flowchart | Common Flowchart Symbols
- Flowchart | Common Flowchart Symbols