Scatter Chart Examples

Use it to draw scatter graphs using ConceptDraw PRO diagramming and vector drawing software for illustrating your documents, presentations and websites.
Blank Scatter Plot

Scatter Plot

Scatter Graph Charting Software

Scatter Graph

 Scatter Diagrams
The Scatter Diagrams solution extends ConceptDraw PRO v10 functionality with templates, samples, and a library of vector stencils that make construction of a Scatter Plot easy. The Scatter Chart Solution makes it easy to design attractive Scatter Diagrams used in various fields of science, work, and life activities. ConceptDraw PRO lets you enter the data to the table and construct the Scatter Plot Graph automatically according to these data.
The vector stencils library "Education charts" contains 12 graphs and charts: area chart, column chart, divided bar diagram, histogram, horizontal bar graph, line graph, pie chart, ring chart, scatter plot.
Use it to create your education infogram in the ConceptDraw PRO diagramming and vector drawing software.
The vector stencils library "Education charts" is included in the Education Infographics solution from the Business Infographics area of ConceptDraw Solution Park.
Use it to create your education infogram in the ConceptDraw PRO diagramming and vector drawing software.
The vector stencils library "Education charts" is included in the Education Infographics solution from the Business Infographics area of ConceptDraw Solution Park.
Area chart - serial

Column chart

Column chart - serial

Divided bar diagram

Frequency histogram

Horizontal bar chart

Horizontal bar chart - serial

Line chart - serial

Pie chart

Ring chart

Scatter plot

Scatter plot - serial

HelpDesk
How to Draw a Scatter Diagram Using ConceptDraw PRO

Bar Graph

The vector stencils library "Marketing charts" contains 12 graphs and charts: area chart, column chart, divided bar diagram, histogram, horizontal bar graph, line graph, pie chart, ring chart, scatter plot.
Use it to create your marketing infograms.
"A chart can take a large variety of forms, however there are common features that provide the chart with its ability to extract meaning from data.
Typically the data in a chart is represented graphically, since humans are generally able to infer meaning from pictures quicker than from text. Text is generally used only to annotate the data.
One of the more important uses of text in a graph is the title. A graph's title usually appears above the main graphic and provides a succinct description of what the data in the graph refers to.
Dimensions in the data are often displayed on axes. If a horizontal and a vertical axis are used, they are usually referred to as the x-axis and y-axis respectively. Each axis will have a scale, denoted by periodic graduations and usually accompanied by numerical or categorical indications. Each axis will typically also have a label displayed outside or beside it, briefly describing the dimension represented. If the scale is numerical, the label will often be suffixed with the unit of that scale in parentheses. ...
The data of a chart can appear in all manner of formats, and may include individual textual labels describing the datum associated with the indicated position in the chart. The data may appear as dots or shapes, connected or unconnected, and in any combination of colors and patterns. Inferences or points of interest can be overlaid directly on the graph to further aid information extraction.
When the data appearing in a chart contains multiple variables, the chart may include a legend (also known as a key). A legend contains a list of the variables appearing in the chart and an example of their appearance. This information allows the data from each variable to be identified in the chart." [Chart. Wikipedia]
The shapes example "Design elements - Marketing charts" was created using the ConceptDraw PRO diagramming and vector drawing software extended with the Marketing Infographics solition from the area "Business Infographics" in ConceptDraw Solution Park.
Graphs and charts

Best Diagramming


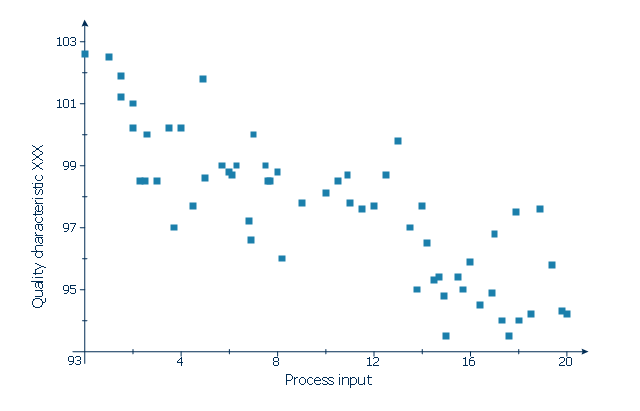
This scatter graph (scattergraph. scatter chart, scatter plot, scatterplot, scatter diagram) example depicts quality characteristic vs. process input. It was designed on the base of the Wikimedia Commons file: Scatter diagram for quality characteristic XXX.svg. [commons.wikimedia.org/ wiki/ File:Scatter_ diagram_ for_ quality_ characteristic_ XXX.svg]
This file is licensed under the Creative Commons Attribution-Share Alike 3.0 Unported license. [creativecommons.org/ licenses/ by-sa/ 3.0/ deed.en]
"Scatterplots are used to graphically display the relationship between two variables. They are commonly used to accompany correlational analyses." [Scatterplot. Wikiversity]
The scatter chart example "Quality characteristic XXX" was created using the ConceptDraw PRO diagramming and vector drawing software extended with the Scatter Diagrams solution from the Graphs and Charts area of ConceptDraw Solution Park.
Scatter chart
Four Dimensions Bubble Plot

This sample clearly shows the Four Dimensions Bubble Diagram of the distribution of chlorine contaminant in the water source. This Bubble Diagram is very useful in the chemistry, hydrology, and ecology.
The Best Flowchart Software Available

ConceptDraw PRO vector diagramming and business graphics software enhanced with with templates, green and interactive flowchart makers, samples and stencil libraries from ConceptDraw Solution Park which all focused to help with drawing flowcharts, block diagrams, bar charts, histograms, pie charts, divided bar diagrams, line graphs, area charts, scatter plots, circular arrows diagrams, Venn diagrams, bubble diagrams, concept maps, and others.

Line Chart Examples

- Scatter Chart Examples | Blank Scatter Plot | Scatter Plot | Scatter ...
- Scatter Graph Charting Software | Scatter Chart Examples | Scatter ...
- Scatter Chart Examples | Blank Scatter Plot | Scatter Chart Analysis ...
- Scatter Chart Examples | Scatter graph - Template | Scatter graphs ...
- Scatter Diagrams | Scatter Chart Examples | Blank Scatter Plot ...
- Blank Scatter Plot | Scatter Chart Examples | Four Dimensions ...
- Scatter Chart Examples | Scatter Diagram | Blank Scatter Plot ...
- Scatter Chart Examples | Line Chart Examples | How to Draw a ...
- Scatter Graph Charting Software | Scatter Plot Graph | Scatter Chart ...
- Scatter Graph Charting Software | Scatter Chart Examples | Scatter ...
- Scatter graphs - Vector stencils library | Scatter Graph | Scatter ...
- Scatter graphs - Vector stencils library | Scatter Graph Charting ...
- Scatter Chart Examples | Scatter Plot Graph | Scatter Graph Charting ...
- The Best Flowchart Software Available | Blank Scatter Plot | Donut ...
- Scatter Plot Us Parks
- Scatter Chart Examples | Bubble Plot | Four Dimensions Bubble Plot ...
- Scatter Graph | Scatter graph - Template | Scatter Graph Charting ...
- Best Vector Drawing Application for Mac OS X | Blank Scatter Plot ...
- Scatter Graph Charting Software | Blank Scatter Plot | Scatter Chart ...
- Blank Scatter Plot | Donut Chart Templates | How to Draw a Pictorial ...
- ERD | Entity Relationship Diagrams, ERD Software for Mac and Win
- Flowchart | Basic Flowchart Symbols and Meaning
- Flowchart | Flowchart Design - Symbols, Shapes, Stencils and Icons
- Flowchart | Flow Chart Symbols
- Electrical | Electrical Drawing - Wiring and Circuits Schematics
- Flowchart | Common Flowchart Symbols
- Flowchart | Common Flowchart Symbols