Picture Graph

Tools to Create Your Own Infographics

Feature Comparison Chart Software

This sample shows the Feature Comparison Chart of the digital scouting cameras. It can be useful for digital cameras production field, marketing, sales, etc.
Basic Flowchart Symbols and Meaning


Relative Value Chart Software

Relative values are widely used in:business, economics, investment, management, marketing, statistics, etc.
ConceptDraw PRO software is the best for drawing professional looking Relative Value Charts. ConceptDraw PRO provides Divided Bar Diagrams solution from the Graphs and Charts Area of ConceptDraw Solution Park.
Process Flowchart


Bar Chart

 Picture Graphs
Typically, a Picture Graph has very broad usage. They many times used successfully in marketing, management, and manufacturing. The Picture Graphs Solution extends the capabilities of ConceptDraw PRO v10 with templates, samples, and a library of professionally developed vector stencils for designing Picture Graphs.
How to Make SWOT Analysis in a Word Document

ConceptDraw products across any platform, meaning you never have to worry about compatibility again. ConceptDraw MINDMAP allows you to make SWOT analysis on PC or macOS operating systems.
Sales Growth. Bar Graphs Example

Star Network Topology

Use it to draw the physical and logical network topology diagrams for wired and wireless computer communication networks.

SWOT Sample in Computers

Rainfall Bar Chart

This sample was created in ConceptDraw PRO diagramming and vector drawing software using the Bar Graphs Solution from the Graphs and Charts area of ConceptDraw Solution Park.
How to Draw a Line Graph

This picture bar graph sample shows the UT Austin Tuition Ranks 6th Compared to Other Texas Public Universities (Tuition and fees per semester, fall 2015). It was designed using data of the diagram "Compare UT Tuition" from the website of the University of Texas at Austin.
[tuition.utexas.edu/ compare]
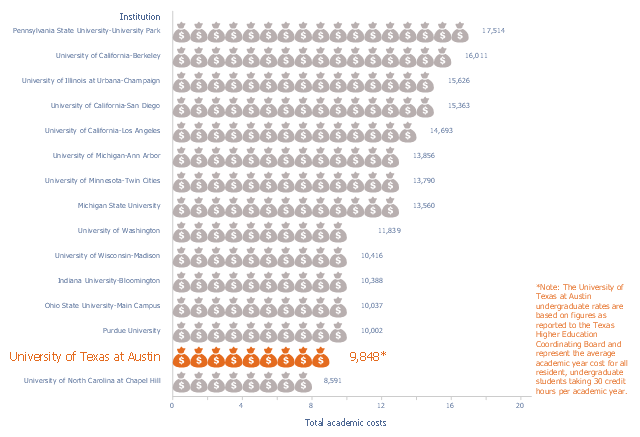
The pictorial chart "Academic costs for residents, 2015-16" was created using the ConceptDraw PRO diagramming and vector drawing software extended with the Picture Graphs solution from the Graphs and Charts area of ConceptDraw Solution Park.
[tuition.utexas.edu/ compare]
The pictorial chart "Academic costs for residents, 2015-16" was created using the ConceptDraw PRO diagramming and vector drawing software extended with the Picture Graphs solution from the Graphs and Charts area of ConceptDraw Solution Park.
Pictorial chart
- Samples Of Comparison Images
- Picture Graphs | Picture Graph | How to Create a Picture Graph in ...
- Picture Graphs | Resident undergraduate tuition and fees at national ...
- How to Draw a Pictorial Chart in ConceptDraw PRO | Sample ...
- How to Create a Picture Graph in ConceptDraw PRO | Marketing ...
- Picture Graphs | Picture Graph | Chart Examples | Images Of Best ...
- Template Or Pictures Of Money
- Pie Graph Worksheets | Bar Diagram Math | Pie Chart Examples and ...
- Images For Bubbl Diagram
- Picture Graphs | Sales Growth. Bar Graphs Example | Picture Graph ...
- Picture Graph | Pictures of Graphs | Sales Growth. Bar Graphs ...
- How to Get Images for Project Presentation on Macintosh | How to ...
- Sales Growth. Bar Graphs Example | What Is a Picture Graph ...
- Barrie population - Picture bar graph | Picture Graph | Sales Growth ...
- Picture Graphs | Sales Growth. Bar Graphs Example | Chart Maker ...
- Example A Picture Graph
- Bar Chart Image
- Time Management Pictures Example
- Bar Graphs | Sales Growth. Bar Graphs Example | Line Graphs ...
- ConceptDraw Solution Park | Divided Bar Diagrams | Picture Graphs ...
- ERD | Entity Relationship Diagrams, ERD Software for Mac and Win
- Flowchart | Basic Flowchart Symbols and Meaning
- Flowchart | Flowchart Design - Symbols, Shapes, Stencils and Icons
- Flowchart | Flow Chart Symbols
- Electrical | Electrical Drawing - Wiring and Circuits Schematics
- Flowchart | Common Flowchart Symbols
- Flowchart | Common Flowchart Symbols