How to Make SWOT Analysis in a Word Document
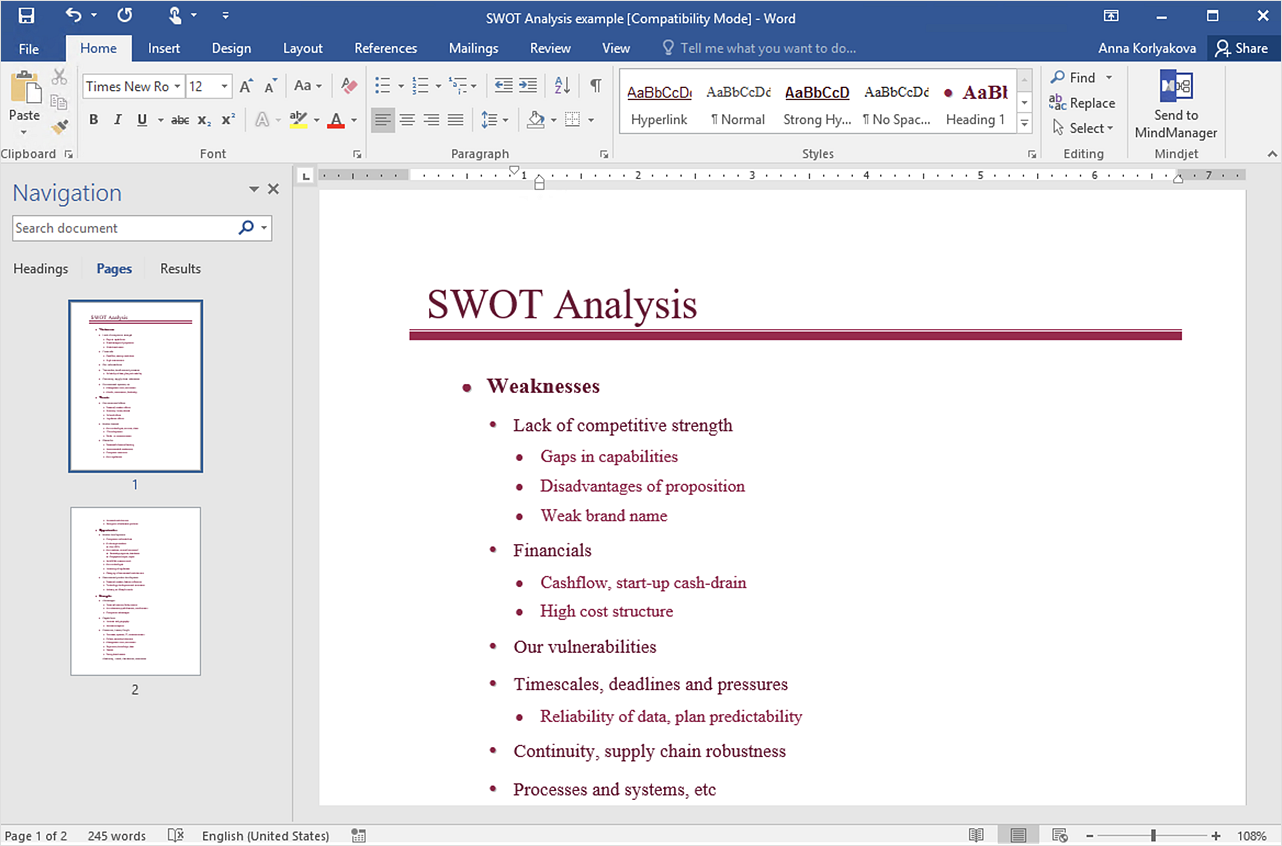
A SWOT Analysis is a popular strategic planning tool used to evaluate the Strengths, Weaknesses, Opportunities, and Threats involved in any businesses. You can export your SWOT mind map into a MS Word document, which makes using SWOT mind map easier if you need to collaborate it with other people.ConceptDraw products across any platform, meaning you never have to worry about compatibility again. ConceptDraw MINDMAP allows you to make SWOT analysis on PC or macOS operating systems.
HelpDesk
How to Make SWOT Analysis in a Word Document
A SWOT analysis is a strategic planning tool that helps to identify and compare strengths and weaknesses with opportunities and threats to make a decision and create an action plan. When performing a SWOT analysis, one can create a table split up into four columns so as to list each impacting element side-by-side for comparison, but typically it is conducted using a four-square SWOT analysis template. Using mind map allows you to collect and structure a piece of information involved in SWOT Analysis then, you can export your SWOT mind map into an MS Word document that allows you to present and collaborate your business strategic SWOT analysis matrix in MS Word document.
 SWOT Analysis
SWOT and TOWS Matrix Diagrams solution extends ConceptDraw DIAGRAM and ConceptDraw MINDMAP software with features, templates, samples and libraries of vector stencils for drawing SWOT and TOWS analysis matrices and mind maps.
HelpDesk
How to Create SWOT Analysis Template
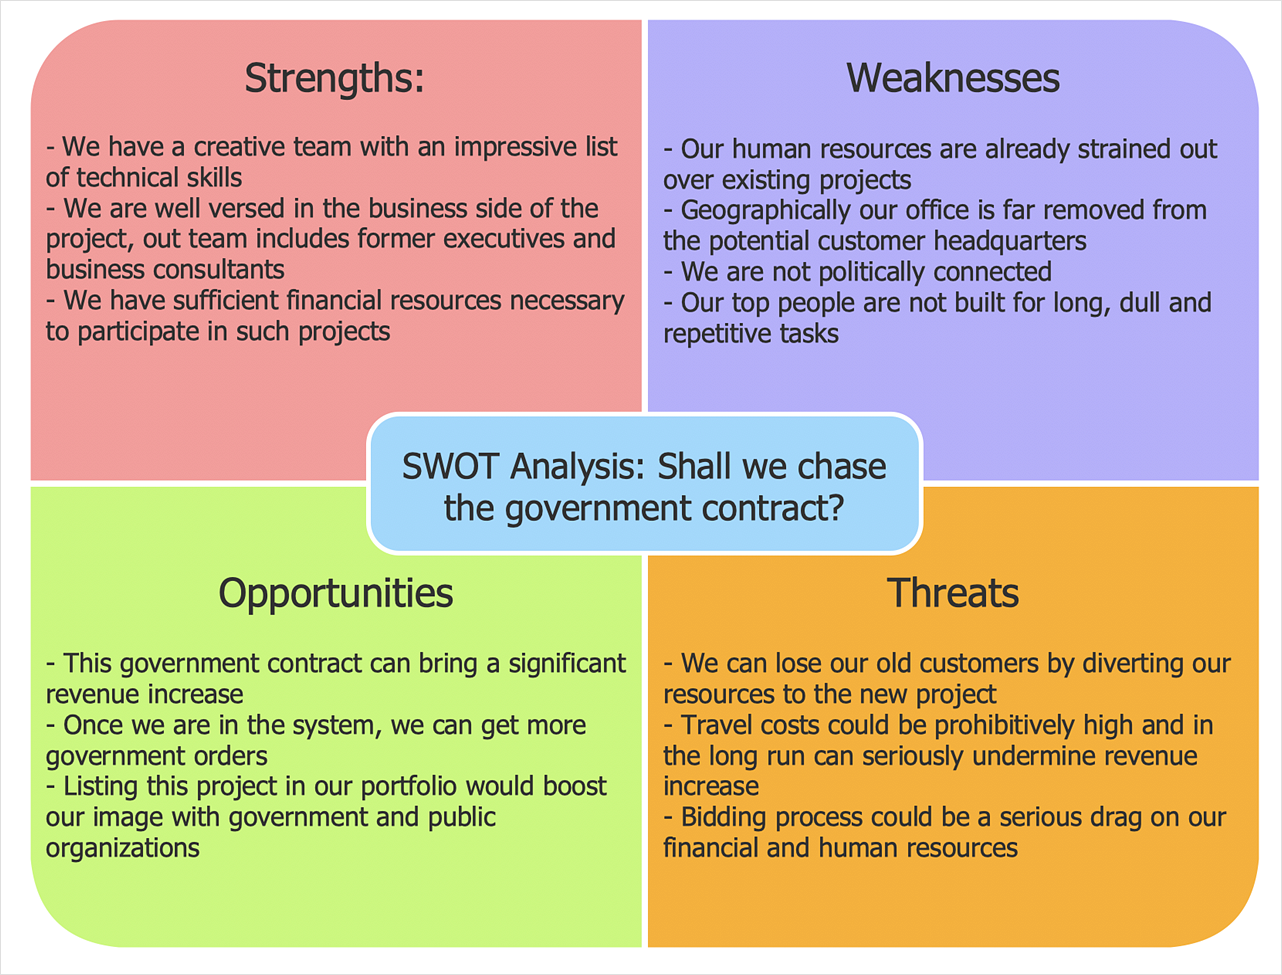
SWOT-analysis is used to develop a marketing strategy. SWOT-analysis includes determining the strengths and weaknesses of the company's activity, potential external threats, and opportunities and assesses their relative strategic competitors. ConceptDraw SWOT and TOWS Matrix Diagrams solution provides a set of SWOT matrix in which should be recorded and then compared the strengths and weaknesses of the enterprise and the market opportunities and threats. This comparison allows you to determine what steps can be taken for the development of your company and what problems need to be addressed urgently.This SWOT matrix diagram example was created on the base of article "An Easy Way To Jumpstart Your Strategic Plan: SWOT" by Leslie Wolf from the website of the California Digital Library, the University of California. "Strategic planning doesn’t have to be a daunting and lengthy process. The goal is really a simple one: to help you understand your world and build a road map to guide your efforts. ...
This analysis tool can help you focus your attention on the specific success factors that are right for your team.
The tool is called a SWOT analysis. SWOT stands for Strengths and Weaknesses, Opportunities and Threats. Here’s what it means:
(1) Strengths are those positive internal attributes that strengthen your business or team. You can develop plans to capitalize on those strengths.
(2) Weaknesses are those negative internal attributes that are working against your success. You can shore up those weaknesses so they don’t stop your success.
(3) Opportunities are those external conditions that can have a positive effect on your goals. These opportunities can point you in the right direction.
(4) Threats are those external conditions that can have a negative effect on your goals. These threats will affect you less if you can identify and minimize them. ...
We thought it would be helpful to show you a sample SWOT analysis for a business you can easily visualize: a small independent bookstore in a university town. The store owner brought the team together to think about how the bookstore could survive during the continuing financial downturn. After an hour of brainstorming, this is the SWOT analysis they developed." [cdlib.org/ cdlinfo/ 2010/ 09/ 29/ an-easy-way-to-jumpstart-your-strategic-plan-swot/ ]
The matrix diagram example "SWOT analysis for a small independent bookstore" was created using the ConceptDraw PRO diagramming and vector drawing software extended with the SWOT Analysis solution from the Management area of ConceptDraw Solution Park.
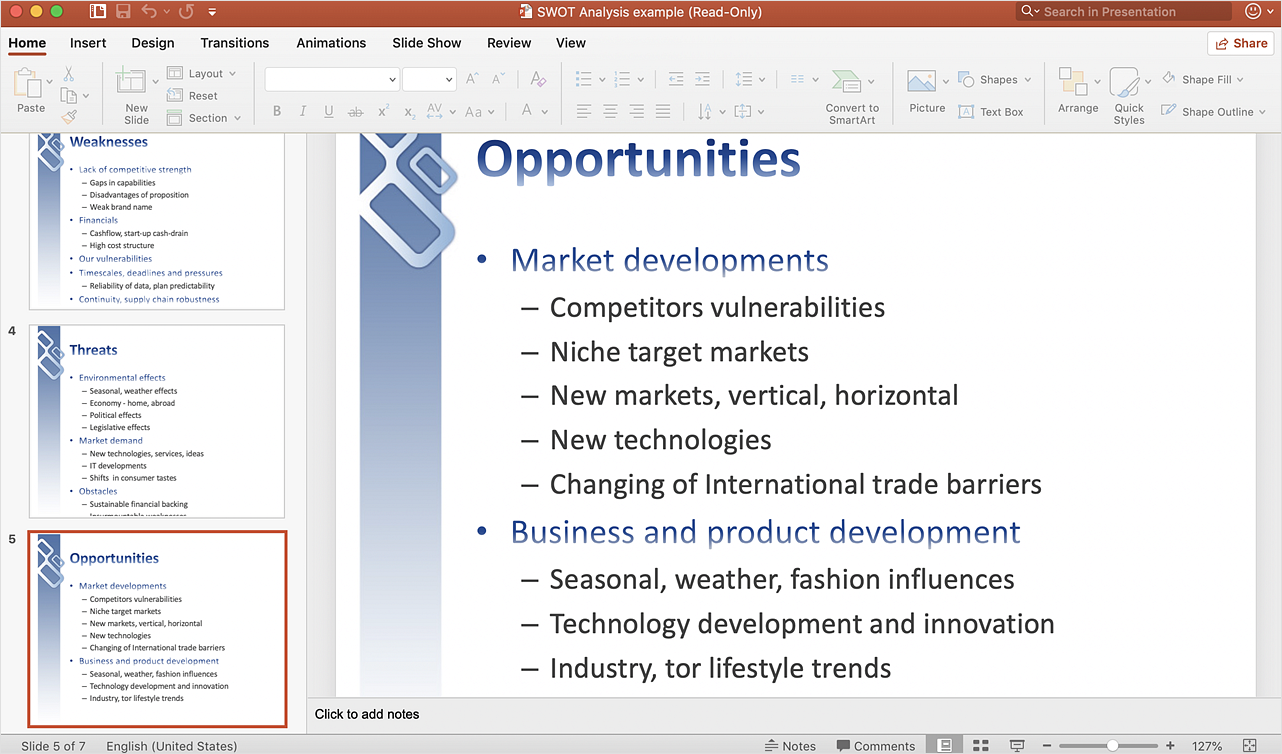
How to Create a PowerPoint Presentation from a SWOT Analysis Mindmap
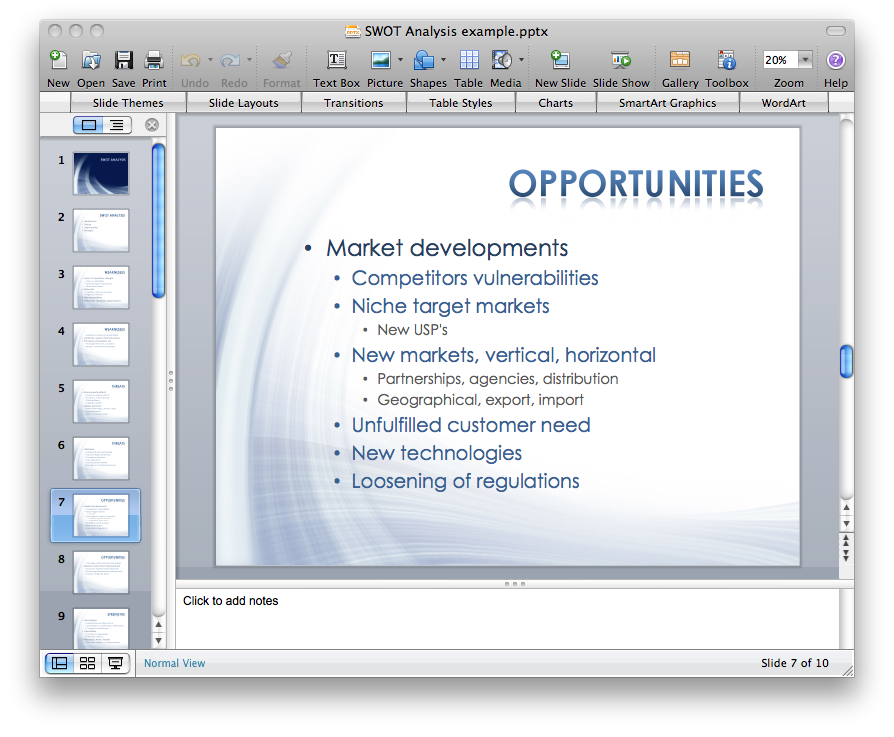
You can use SWOT analysis PowerPoint presentation to represent strengths, weakness, opportunities, and threats involved in your SWOT matrix.HelpDesk
How to Create a SWOT Matrix Quickly
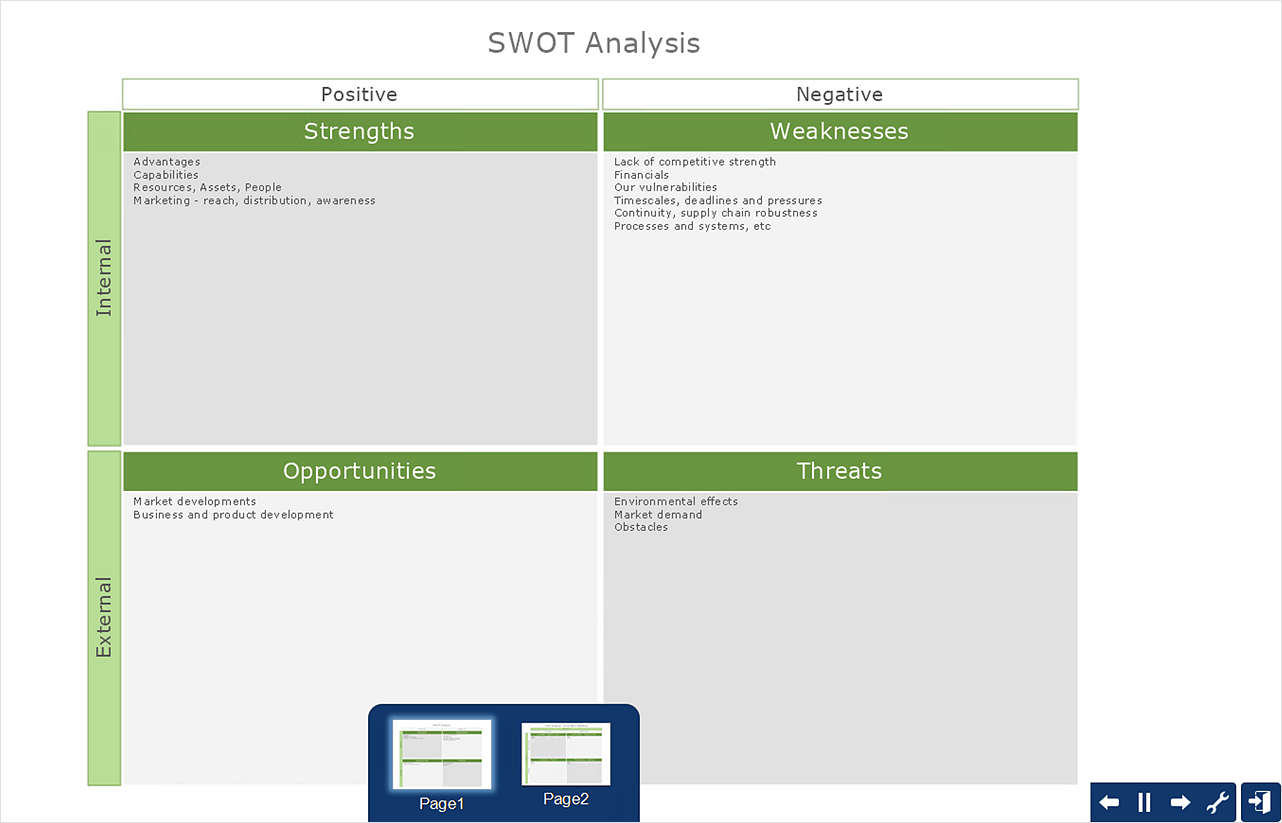
ConceptDraw DIAGRAM allows creating SWOT Matrix in just one click for presenting analysis results performed in mind map structure using ConceptDraw MINDMAP.
 SWOT and TOWS Matrix Diagrams
SWOT and TOWS Matrix Diagrams solution extends ConceptDraw DIAGRAM and ConceptDraw MINDMAP software with features, templates, samples and libraries of vector stencils for drawing SWOT and TOWS analysis matrices and mind maps.
HelpDesk
How to Create a PowerPoint Presentation from a SWOT Matrix
You can use SWOT analysis PowerPoint presentation to represent strengths, weakness, opportunities, and threats involved in your SWOT matrix. We recommend using ConceptDraw MINDMAP for identifying and structuring factors employed in SWOT Analysis. Then, you can export the SWOT Matrix to PowerPoint slides.Ansoff Matrix
ConceptDraw DIAGRAM software extended with Matrices Solution from the Marketing Area of ConceptDraw Solution Park offers you the possibility to develop the Ansoff Matrix of any complexity.ConceptDraw MINDMAP : Brainstorming, Mind Mapping for macOS and Windows
ConceptDraw MINDMAP is a powerful business and personal productivity software application that provides visual organization and access to information for individuals and organizations.Venn Diagram
Venn diagrams are illustrations used in the branch of mathematics known as set theory. They show the mathematical or logical relationship between different groups of things (sets). A Venn diagram shows all the possible logical relations between the sets.Gant Chart in Project Management
Gant Chart is a graphical representation of tasks as segments on a time scale. It helps plan and monitor project development or resource allocation. The horizontal axis is a time scale, expressed either in absolute or relative time.
Organigrams with ConceptDraw DIAGRAM
ConceptDraw - Organigram software allows quickly create Organigrams and much more. ConceptDraw DIAGRAM is an ideal tool for Administrative staff to clearly demonstrate the company orgchart professional.- Sample To Draw Up A Swot Analysis
- SWOT Matrix Template | SWOT Analysis | SWOT analysis for a small ...
- How to Make SWOT Analysis in a Word Document | SWOT Template ...
- SWOT Analysis Solution - Strategy Tools | How to Make SWOT ...
- Sample Swot Analysis For Finance Department
- Swot Analysis Examples
- BCG Matrix | SWOT analysis matrix diagram templates | SWOT ...
- SWOT Analysis | Swot Analysis Examples | What is SWOT Analysis ...
- How to Make SWOT Analysis in a Word Document | How to Make ...
- Swot Analysis Examples for Mac OSX | SWOT Matrix Template ...
- Swot Analysis Examples | SWOT Template | How to Make SWOT ...
- Hr Swot Analysis
- How to Make SWOT Analysis in a Word Document | SWOT Matrix ...
- Feature Comparison Chart Software | Bar Chart Template for Word ...
- SWOT Analysis Solution - Strategy Tools | SWOT Matrix Template ...
- How to Make SWOT Analysis in a Word Document | SWOT analysis ...
- Swot Analysis Examples In Sports
- How to Make SWOT Analysis in a Word Document | Software for ...
- How to Create SWOT Analysis Template Using ConceptDraw PRO ...
- SWOT Analysis | SWOT Matrix Template | SWOT Analysis | Personal ...
- ERD | Entity Relationship Diagrams, ERD Software for Mac and Win
- Flowchart | Basic Flowchart Symbols and Meaning
- Flowchart | Flowchart Design - Symbols, Shapes, Stencils and Icons
- Flowchart | Flow Chart Symbols
- Electrical | Electrical Drawing - Wiring and Circuits Schematics
- Flowchart | Common Flowchart Symbols
- Flowchart | Common Flowchart Symbols

