This site uses cookies. By continuing to browse the ConceptDraw site you are agreeing to our Use of Site Cookies.

Gantt chart examples

All Gantt charts were made using ConceptDraw PROJECT. ConceptDraw PROJECT works both on Windows and Mac OS X. It allows to schedule a voluntary number of projects in a single Workspace document and lets easily share tasks and resources among them. ConceptDraw PROJECT shares files among Windows and Mac OS X.

Gant Chart in Project Management

Gant Chart is a graphical representation of tasks as segments on a time scale. It helps plan and monitor project development or resource allocation. The horizontal axis is a time scale, expressed either in absolute or relative time.
what is software project management
HelpDesk

How to Create a Gantt Chart for Your Project

Instruction on how to create Gantt chart using ConceptDraw PROJECT software.
Gant Chart is a graphical representation of tasks as segments on a time scale. It helps plan or overlapping.
HelpDesk

How to Draw a Gantt Chart

A Gantt chart is intended to provide a visualization of a project schedule. It is developed to help planning, coordinating, and tracking on project tasks implementation. One of the most critical resources for project implementation is a time resource. Gantt chart - is one of the most convenient and popular ways of graphical representation of project tasks progress in conjunction with the corresponding time consumption. Gantt chart's function is to show project tasks completed in a progress and to make a project manager sure that project tasks were completed on time. ConceptDraw OFFICE is a clear and easy-to-use tool for project management. It is a very handy visual tool that helps make a project processing clear.
HelpDesk

How to Customize Columns in Your Project Schedule

Some ConceptDraw PROJECT users need to start new projects from their custom default page. In this post, we tell you how to make it.

Examples of Flowcharts, Org Charts and More

ConceptDraw examples covers a broad spectrum of business graphics categories. We separated all the graphic documents on application areas and had produced multiple solutions for each of them. ConceptDraw provides a wide variety of examples such as flowcharts, organizational charts, business charts, UML diagrams, database and ERD, directional map, network diagrams and lots more. Each solution accommodates 10+ examples that shows specific application cases of a diagram. ConceptDraw STORE is an application for downloading solutions with examples, templates and stencil libraries. Please choose any examples you are interested in, alternatively download them for free; you will need to install ConceptDraw to view them. As you will see, ConceptDraw is very powerful, you can use more than 10000 symbols, examples, and many pre-drawn templates, to create your own spectacular flowcharts, business diagrams, network diagrams and lots more, effortlessly, and in no time at all.
What is ConceptDraw OFFICE
HelpDesk

How to Plan and Allocate Resources with ConceptDraw PROJECT on PC

Effective resource management is a key factor in successful project implementation. The common types of resources for which the project manager has an impact include material resources (materials, energy), staff (work) and equipment. ConceptDraw PROJECT provides easy ways to project Resources Management: Create a list of project resources and assign the right human resource, as well as the necessary material, or equipment to be used.

What Constitutes a Project?

Separated into categories of Basic, Intermediate, and Advanced categories, the new instructional videos about ConceptDraw PROJECT cover a huge breadth of topics. Users new to ConceptDraw PROJECT will find the Basic lessons an essential platform for familiarizing themselves with the programs′s functions. This video lesson is the first in Basic lessons series.
what is software project management
HelpDesk

What Information to be Displayed in the ConceptDraw PROJECT Gantt Chart View

What information can can contain the project task list? Gantt Chart view is a graphical representation of a project outline that allows one to allocate tasks.You can customize a project’s tasks list view to include the columns you need to meet your information requirements. The columns of the ConceptDraw PROJECT Gantt view contain the information you want to capture about each task in your project. The following article details what information can be contained in the columns of a project outline.
HelpDesk

How to Export Project Data to MS Excel Worksheet

You can share your ConceptDraw PROJECT files with colleagues who use MS Excel®using the export capabilities of the PROJECT.
HelpDesk

How to Shift Dates in ConceptDraw PROJECT

A way to shift all dates in a project a specified period, so you can use old project schedules as a template for new schedules
HelpDesk

How to Import Project Data From MS Excel File

You can import information into the project from MS Excel workbook using the entered fields - fields in which you can enter or edit information as opposed to calculated fields.
HelpDesk

How to Input Data from MS Excel Into a Mind Map

Many people apply Excel documents to store data in the form of hierarchical lists. With ConceptDraw MINDMAP you can easily turn the linear structure of an Excel table in a radial structure of mind map ConceptDraw MINDMAP will create a mind map file (CDMZ) from your Excel (XLS) file. If you keep your information in the Microsoft Excel files, you can import them into ConceptDraw MINDMAP, converting the columns and rows to a hierarchically structured mind map. If you have multiple individual sheets in your Excel workbook, ConceptDraw MINDMAP will turn them into a single multi-page mind map. ConceptDraw MINDMAP lets you import an entire Microsoft® Excel file as well as insert data from the selected cells.
HelpDesk

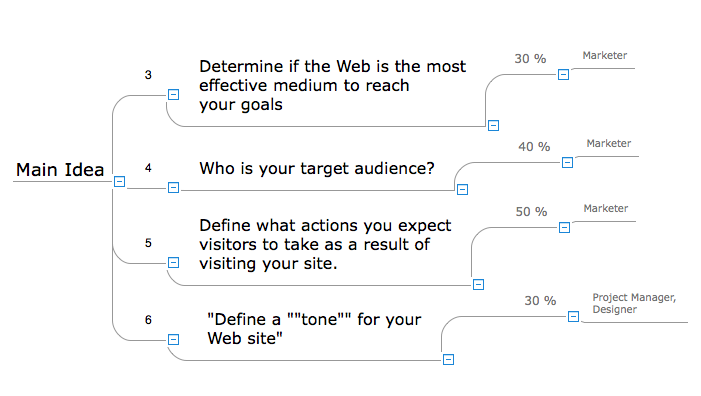
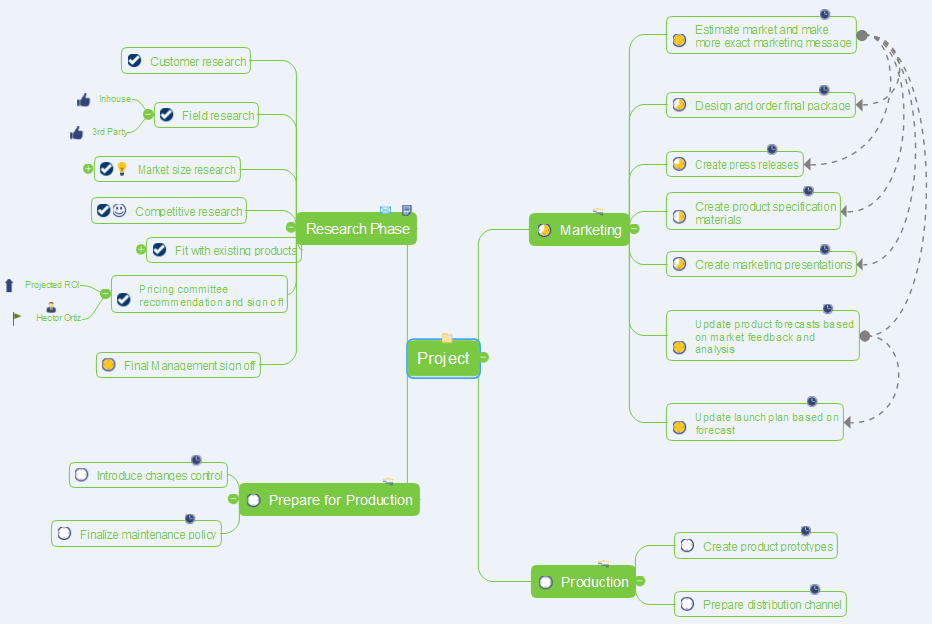
How to Make a Project Tasks Mind Map from Brainstorm

Start a project with creating a mind map, structuring ideas captured during a brainstorming session. The easiest way to start a new project is to conduct a brainstorming session that identifies the necessary tasks and then to develop it into a project schedule.
HelpDesk

How to Make a Mind Map from a Project Gantt Chart

ConceptDraw Office allows you to see the project data from ConceptDraw PROJECT in a mind map structure by opening your project in ConceptDraw MINDMAP.

Business diagrams & Org Charts with ConceptDraw DIAGRAM

Business flowcharting tool helps you create a flowchart with minimal effort. With ConceptDraw you can make a flowchart, draw data flow diagrams, orgchart professional, process flow diagrams etc - without any prior knowledge or training.
Draw Business Process Diagrams
HelpDesk

How to Get Images for Project Presentation on Windows

ConceptDraw PROJECT allows you to easily make slides for presentation.
HelpDesk

How to Change the Working Time in a Project

Project calendar determines working and non-working time of the project. It is used as a base to the project schedule development. There two types of project calendars: Project Calendar - which sets the working time for the whole project; and the Resource Calendar- which sets the working time of the particular project resource. The following article describes how to change the default calendar in ConceptDraw PROJECT.
HelpDesk

How to Generate Tabular Reports in ConceptDraw PROJECT for Windows

The reporting capabilities of ConceptDraw PROJECT are really impressive. This section will help you find out what useful information can be obtained when using ConceptDraw PROJECT standard tabular reports in MS Excel.