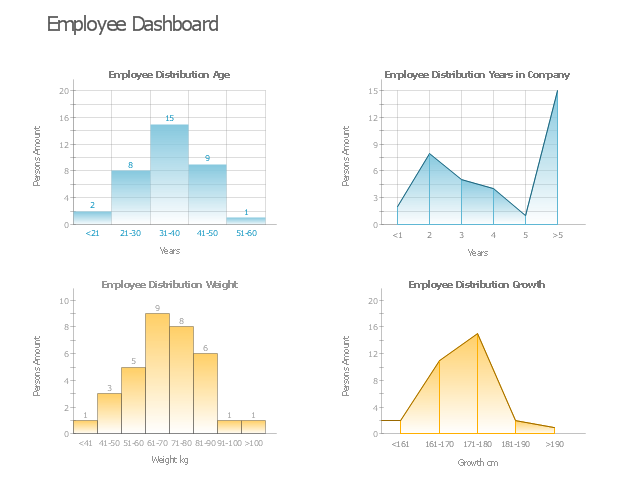
This HR dashboard example include histograms "Employee Distribution by Age" and "Employee Distribution by Weight", and area charts "Employee Distribution by Years in Company" and "Employee Distribution by Growth".
"Human resources is the set of individuals who make up the workforce of an organization, business sector, or economy. "Human capital" is sometimes used synonymously with human resources, although human capital typically refers to a more narrow view (i.e., the knowledge the individuals embody and can contribute to an organization). Likewise, other terms sometimes used include "manpower", "talent", "labour", or simply "people". The professional discipline and business function that oversees an organization's human resources is called human resource management (HRM, or simply HR)." [Human resources. Wikipedia]
The example "HR dashboard" was created using the ConceptDraw PRO diagramming and vector drawing software extended with the Frequency Distribution Dashboard solution from the area "What is a Dashboard" of ConceptDraw Solution Park.
Visual dashboard
 Frequency Distribution Dashboard
Frequency distribution dashboard solution extends ConceptDraw PRO software with samples, templates and vector stencils libraries with histograms and area charts for drawing the visual dashboards showing frequency distribution of data.
 Time Series Dashboard
Time series dashboard solution extends ConceptDraw PRO software with templates, samples and vector stencils libraries with charts, graphs and plots for drawing the visual dashboards showing data time series.
 HR Flowcharts
Human resource management diagrams show recruitment models, the hiring process and human resource development of human resources.
 Status Dashboard
Status dashboard solution extends ConceptDraw PRO software with templates, samples and vector stencils libraries with graphic indicators for drawing the visual dashboards showing status data.
 Sales Dashboard
Sales Dashboard solution extends ConceptDraw PRO software with templates, samples and library of vector stencils for drawing the visual dashboards of sale metrics and key performance indicators (KPI).
 Meter Dashboard
Meter dashboard solution extends ConceptDraw PRO software with templates, samples and vector stencils library with meter indicators for drawing visual dashboards showing quantitative data.
 Business Intelligence Dashboard
Business Intelligence Dashboard solution extends the ConceptDraw PRO v11 functionality with exclusive tools, numerous ready-to-use vector objects, samples and quick-start templates for creation professional Business Intelligence Dashboards, Business Intelligence Graphics, Business Intelligence Charts and Maps of different kinds. Design easy the BI dashboard, BI model or Dynamic chart in ConceptDraw PRO to monitor the company's work, to track the indicators corresponding your company's data, to display and analyze key performance indicators, to evaluate the trends and regularities of the processes occurring at the company.
Visualize Sales Data Using Sample Data

 ConceptDraw Dashboard for Facebook
ConceptDraw Dashboard for Facebook solution extends ConceptDraw PRO software with a dynamically updated visual dashboard, which shows lifetime total likes, daily friends of fans, and daily page views, information you can receive from Facebook Insights.
 PM Dashboards
This solution extends ConceptDraw PRO and ConceptDraw PROJECT software with the ability to clearly display the identified key performance indicators for any project.
 Spatial Dashboard
Spatial dashboard solution extends ConceptDraw PRO software with templates, samples and vector stencils libraries with thematic maps for drawing visual dashboards showing spatial data.
 Comparison Dashboard
Comparison dashboard solution extends ConceptDraw PRO software with samples, templates and vector stencils library with charts and indicators for drawing the visual dashboard comparing data.
 Composition Dashboard
Composition dashboard solution extends ConceptDraw PRO software with templates, samples and vector stencils library with charts and indicators for drawing visual dashboards showing data composition.
 Correlation Dashboard
Correlation dashboard solution extends ConceptDraw PRO software with samples, templates and vector stencils library with Scatter Plot Charts for drawing the visual dashboard visualizing data correlation.
- Human Resource Dashboard Example
- Employee distribution - HR dashboard | How to Create a HR ...
- Hr Dashboard Example
- Hr Dashboards Examples
- Human Resources Dashboard Template
- Employee distribution - HR dashboard | HR dashboard | Frequency ...
- Frequency Distribution Dashboard | Hr Dashboard Samples
- Employee distribution - HR dashboard | Frequency Distribution ...
- Employee distribution - HR dashboard | Projects HR dashboard | HR ...
- Frequency Distribution Dashboard | Time Series Dashboard | HR ...
- Projects HR dashboard | Competitor Analysis | Project Management ...
- HR Flowcharts | HR Flowchart Symbols | How to Create a HR ...
- Hr Metrics Dashboard Example
- Project Dashboard Example
- Hr Metrics Dashboard Template
- Employee distribution - HR dashboard | HR dashboard | KPI ...
- Kpi Hr Examples
- Recruitment Dashboard Sample
- Projects HR dashboard | Cross-Functional Flowcharts | HR ...
- Website KPIs - Visual dashboard | Projects HR dashboard | PM ...
- ERD | Entity Relationship Diagrams, ERD Software for Mac and Win
- Flowchart | Basic Flowchart Symbols and Meaning
- Flowchart | Flowchart Design - Symbols, Shapes, Stencils and Icons
- Flowchart | Flow Chart Symbols
- Electrical | Electrical Drawing - Wiring and Circuits Schematics
- Flowchart | Common Flowchart Symbols
- Flowchart | Common Flowchart Symbols