HelpDesk
How to Draw a Pie Chart

 Pie Charts
Pie Charts are extensively used in statistics and business for explaining data and work results, in mass media for comparison (i.e. to visualize the percentage for the parts of one total), and in many other fields. The Pie Charts solution for ConceptDraw DIAGRAM offers powerful drawing tools, varied templates, samples, and a library of vector stencils for simple construction and design of Pie Charts, Donut Chart, and Pie Graph Worksheets.
HelpDesk
How to Draw the Different Types of Pie Charts

 Sales Dashboard
Sales Dashboard solution extends ConceptDraw DIAGRAM software with templates, samples and library of vector stencils for drawing the visual dashboards of sale metrics and key performance indicators (KPI).
This financila dashboard example was drawn on the base of the Enterprise dashboard from the Mecklenburg County Government website.
[charmeck.org/ mecklenburg/ county/ CountyManagersOffice/ OMB/ dashboards/ Pages/ Enterprise.aspx]
"In management information systems, a dashboard is "an easy to read, often single page, real-time user interface, showing a graphical presentation of the current status (snapshot) and historical trends of an organization’s key performance indicators to enable instantaneous and informed decisions to be made at a glance."
For example, a manufacturing dashboard may show key performance indicators related to productivity such as number of parts manufactured, or number of failed quality inspections per hour. Similarly, a human resources dashboard may show KPIs related to staff recruitment, retention and composition, for example number of open positions, or average days or cost per recruitment.
Types of dashboards.
Dashboard of Sustainability screen shot illustrating example dashboard layout.
Digital dashboards may be laid out to track the flows inherent in the business processes that they monitor. Graphically, users may see the high-level processes and then drill down into low level data. This level of detail is often buried deep within the corporate enterprise and otherwise unavailable to the senior executives.
Three main types of digital dashboard dominate the market today: stand alone software applications, web-browser based applications, and desktop applications also known as desktop widgets. The last are driven by a widget engine.
Specialized dashboards may track all corporate functions. Examples include human resources, recruiting, sales, operations, security, information technology, project management, customer relationship management and many more departmental dashboards.
Digital dashboard projects involve business units as the driver and the information technology department as the enabler. The success of digital dashboard projects often depends on the metrics that were chosen for monitoring. Key performance indicators, balanced scorecards, and sales performance figures are some of the content appropriate on business dashboards." [Dashboard (management information systems). Wikipedia]
The example "Enterprise dashboard" was created using the ConceptDraw PRO diagramming and vector drawing software extended with the Composition Dashboard solution from the area "What is a Dashboard" of ConceptDraw Solution Park.
Financial dashboard

This ring chart sample was redesigned from the Wikipedia file: Virtuous circle in management.svg.
"An example of the use of a virtuous circle in management."
[en.wikipedia.org/ wiki/ File:Virtuous_ circle_ in_ management.svg]
"A virtuous circle and a vicious circle (also referred to as virtuous cycle and vicious cycle) are economic terms. They refer to a complex chain of events that reinforces itself through a feedback loop. A virtuous circle has favorable results, while a vicious circle has detrimental results.
Both circles are complexes of events with no tendency towards equilibrium (at least in the short run). Both systems of events have feedback loops in which each iteration of the cycle reinforces the previous one (positive feedback). These cycles will continue in the direction of their momentum until an external factor intervenes and breaks the cycle. The prefix "hyper-" is sometimes used to describe these cycles if they are extreme. The best-known example of a vicious circle is hyperinflation. ...
Example in management.
Virtuous circle.
An employer's investment in his employees’ ability to provide superior service to customers can be seen as a virtuous circle. Effort spent in selecting and training employees and creating a corporate culture in which they are empowered can lead to increased employee satisfaction and employee competence. This can result in superior service delivery and customer satisfaction. This in turn will create customer loyalty, improved sales levels, and higher profit margins. Some of these profits can be reinvested in employee development, thereby initiating another iteration of a virtuous cycle." [en.wikipedia.org/ wiki/ Virtuous_ circle_ and_ vicious_ circle]
The ring chart example "Virtuous circle (management)" was created using the ConceptDraw PRO diagramming and vector drawing software extended with the Target and Circular Diagrams solution from the Marketing area of ConceptDraw Solution Park.
www.conceptdraw.com/ solution-park/ marketing-target-and-circular-diagrams
Ring chart
---ring-chart.png--diagram-flowchart-example.png)
 Target and Circular Diagrams
This solution extends ConceptDraw DIAGRAM software with samples, templates and library of design elements for drawing the Target and Circular Diagrams.
HelpDesk
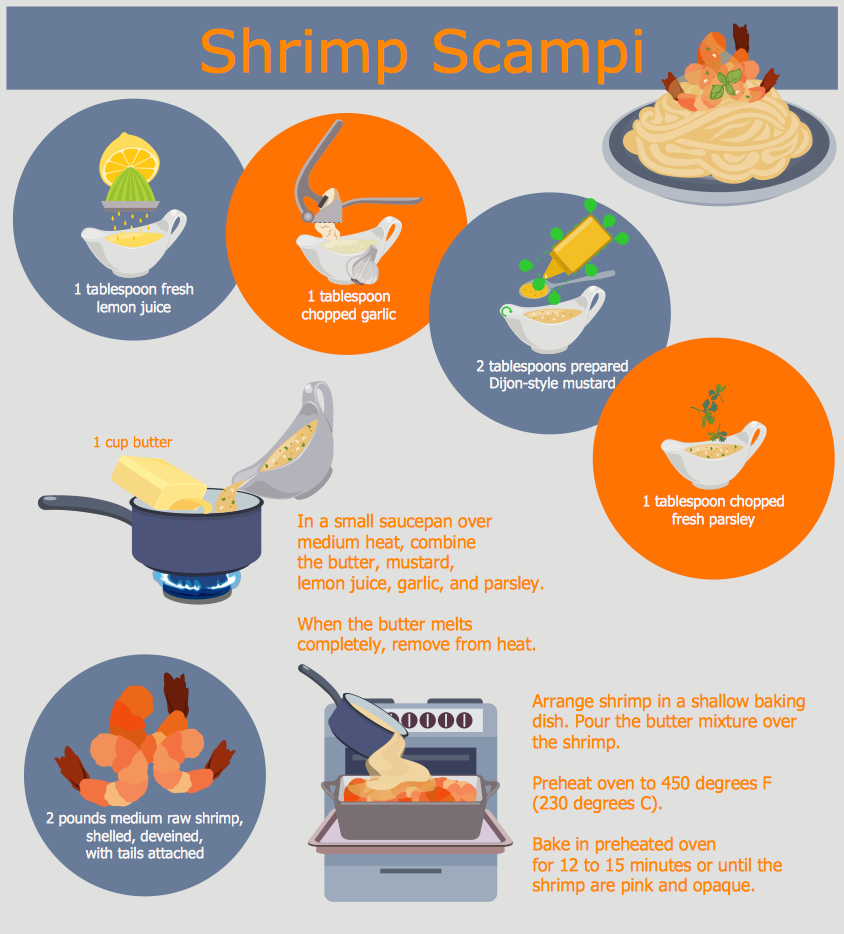
How to Design a Food-related Infographics
HelpDesk
How to Create Data-Driven Infographics

 Basic Diagramming
This solution extends ConceptDraw DIAGRAM software with the specific tools you need to easily draw flowcharts, block diagrams, histograms, pie charts, divided bar diagrams, line graphs, circular arrows diagrams, Venn diagrams, bubble diagrams and concept maps
 Composition Dashboard
Composition dashboard solution extends ConceptDraw DIAGRAM software with templates, samples and vector stencils library with charts and indicators for drawing visual dashboards showing data composition.
Pyramid Chart Examples

Bar Chart Template for Word

You can quickly rework these bar graph templates into your own charts by simply changing displayed data, title and legend texts.
 Rapid UML
Rapid UML solution extends ConceptDraw DIAGRAM software with templates, samples and libraries of vector stencils for quick drawing the UML diagrams using Rapid Draw technology.
- Total Quality Management Value | Percentage Pie Chart . Pie Chart ...
- Project Management Area | Project tasks dashboard | Schedule pie ...
- Sales Growth. Bar Graphs Example | Financial Comparison Chart ...
- Sales dashboard - Vector stencils library | Sales dashboard - Vector ...
- Sales Growth. Bar Graphs Example | Sales Dashboard | Sales ...
- Schedule pie chart - Daily action plan | Pie Graph Worksheets ...
- Sales KPIs - Performance dashboard | Sales geographically ...
- Pie Chart Software | Pie Chart Examples and Templates | Pie Charts ...
- Sale dashboard | Sales dashboard - Vector stencils library | Project ...
- Sales Growth. Bar Graphs Example
- Sales dashboard - Vector stencils library | Management indicators ...
- Design elements - Composition charts and indicators | Pie Chart ...
- Schedule pie chart - Daily action plan | Seven Management and ...
- Arrow circle chart - Template | Pie Chart Examples and Templates ...
- Schedule pie chart - Daily action plan | TQM Diagram ...
- Army Flow Charts | Gant Chart in Project Management | How to ...
- Pie Chart Examples and Templates | Chart Maker for Presentations ...
- Business Report Pie. Pie Chart Examples | Pie Donut Chart. Pie ...
- Schedule pie chart - Daily action plan | Graph And Chat Daily Activities
- Pie Donut Chart. Pie Chart Examples | Flowcharts in PowerPoint ...
- ERD | Entity Relationship Diagrams, ERD Software for Mac and Win
- Flowchart | Basic Flowchart Symbols and Meaning
- Flowchart | Flowchart Design - Symbols, Shapes, Stencils and Icons
- Flowchart | Flow Chart Symbols
- Electrical | Electrical Drawing - Wiring and Circuits Schematics
- Flowchart | Common Flowchart Symbols
- Flowchart | Common Flowchart Symbols