Sales Growth. Bar Graphs Example

Sales Dashboards for Your Company
Sales Dashboard
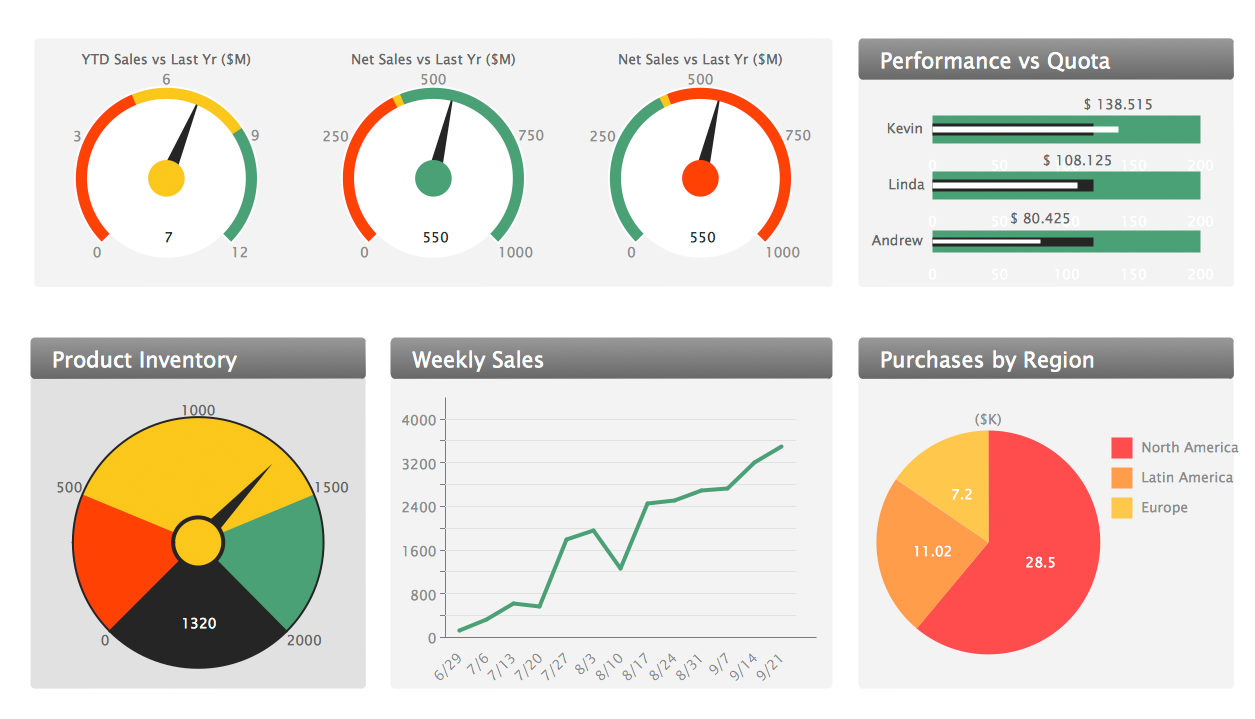
ConceptDraw DIAGRAM software extended with Sales Dashboard solution from the Marketing area of ConceptDraw Solution Park is effective for visualizing sales data, all set of KPIs on the Sales Dashboard with purpose to see how your business develops and to make conclusions for improvement the sales.
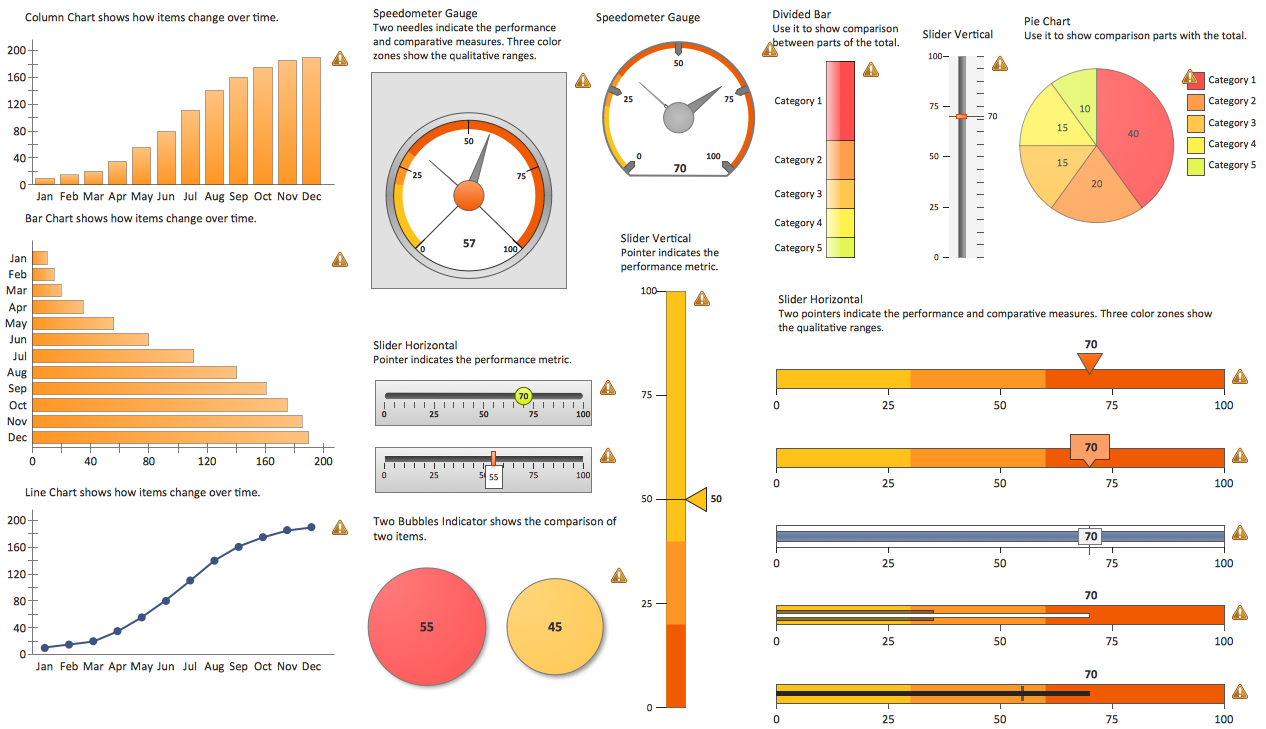
The vector stencils library "Sales KPIs and Metrics" contains 15 chart templates and graphic indicators of sales key performance indicators (KPIs) and metrics.
Use it for drawing sales dashboards in the ConceptDraw PRO diagramming and vector drawing software extended with the Sales Dashboard solution from the Marketing area of ConceptDraw Solution Park.
Use it for drawing sales dashboards in the ConceptDraw PRO diagramming and vector drawing software extended with the Sales Dashboard solution from the Marketing area of ConceptDraw Solution Park.
Actual vs Plan

Average Purchase Value

Clicks from Sales Follow-Up Emails

Cost per customer

Cost per order

Lead Response Time

Opportunity-to-Win Ratio

Product mix

Product Performance

Rate of Contact

Rate of Follow Up Contact

Sales Growth

Sales Target

Social Media Usage

Usage Rate of Marketing Collateral

The vector stencils library "Sales department" contains 49 company department icons.
Use these sales pictograms to draw your sales flowcharts, workflow diagrams and process charts with the ConceptDraw PRO diagramming and vector drawing software.
The vector stencils library "Sales department" is included in the Sales Flowcharts solution from the Marketing area of ConceptDraw Solution Park.
Accounting

Accounts payable

Accounts receivable

Audit

Bank

Board of directors

Copy center

Customer service operator

Customer service technician

Data center

Delivery

Design

Devices management

Distribution

Distribution

Employee

Engineering

Facilities

Finance

Human resource

Devices management

Information systems

International division

International marketing

International sales

Inventory

Legal department

Mail room

Mail service

Management

Manufacturing

Marketing

Motorpool

Online service

Packaging

Payroll

Publications

Purchasing

Quality assurance

Receiving

Reception

Research and development

Sales growth

Scales

Security

Shipping

Suppliers

Telecommunication

Warehouse

Growth-Share Matrix Software

The Matrices Solution also provides a wide variety of templates and samples that will help you to create the Matrix diagrams of any difficulty.
The vector stencils library "HR department" contains 50 workflow symbols.
Use this department icon set to draw your HR process flowcharts, workflow diagrams and infographics with the ConceptDraw PRO diagramming and vector drawing software.
The HR pictograms library "HR department" is included in the HR Flowcharts solution from the Management area of ConceptDraw Solution Park.
Accounting

Accounts payable

Accounts receivable

Audit

Bank

Board of directors

Career center

Copy center

Customer service operator

Customer service technician

Data center

Delivery

Design

Devices management

Distribution

Distribution 2

Employee

Engineering

Facilities

Finance

Human resource

Information services

Information systems

International division

International marketing

International sales

Inventory

Legal department

Mail room

Mail service

Management

Manufacturing

Marketing

Motorpool

Online service

Packaging

Payroll

Publications

Purchasing

Quality assurance

Receiving

Reception

Research and development

Scales

Sales growth

Security

Shipping

Suppliers

Telecommunication

Warehouse

Financial Comparison Chart

Bar Chart Software

The vector stencils library "Sales KPIs and Metrics" contains 15 chart templates and graphic indicators of sales key performance indicators (KPIs) and metrics for drawing sales dashboards: line charts "Cost per order" and "Clicks from Sales Follow-Up Emails", column charts "Social Media Usage" and "Usage Rate of Marketing Collateral", horizontal bar charts "Rate of Follow Up Contact", "Cost per customer" and "Lead Response Time", pie charts "Product mix", "Product Performance" and "Rate of Contact", gauge (speedometer) indicators "Sales Growth" and "Actual vs Plan", bullet indicator "Sales Target", diamond alarm indicators "Average Purchase Value", "Quote to Close Ratio", "Opportunity-to-Win Ratio" and "Sales Ratio".
The dashboard charts and indicators example "Design elements - Sales KPIs and metrics" for the ConceptDraw PRO diagramming and vector drawing software is included in the Sales Dashboard solution from the Marketing area of ConceptDraw Solution Park.
www.conceptdraw.com/ solution-park/ marketing-sales-dashboard
Sales dashboard charts and graphic indicators

- Business Graphs Examples
- Sales Growth . Bar Graphs Example | Sales Dashboards for Your ...
- Pie Chart Software | Sales Growth . Bar Graphs Example | Financial ...
- Bar Graphs | Sales Growth . Bar Graphs Example | Bar Diagrams for ...
- Sales Growth . Bar Graphs Example | Financial Comparison Chart ...
- Chart And Graph Examples On Sales
- Sales Growth . Bar Graphs Example
- Sales Growth . Bar Graphs Example | Bar Diagrams for Problem ...
- Sales Growth . Bar Graphs Example | Create Graphs and Charts ...
- Picture Graph | Pictures of Graphs | Sales Growth . Bar Graphs ...
- ERD | Entity Relationship Diagrams, ERD Software for Mac and Win
- Flowchart | Basic Flowchart Symbols and Meaning
- Flowchart | Flowchart Design - Symbols, Shapes, Stencils and Icons
- Flowchart | Flow Chart Symbols
- Electrical | Electrical Drawing - Wiring and Circuits Schematics
- Flowchart | Common Flowchart Symbols
- Flowchart | Common Flowchart Symbols