HelpDesk
How to Create a Data Flow Diagram using ConceptDraw PRO
 example")
HelpDesk
Accounting Information Systems Flowchart Symbols

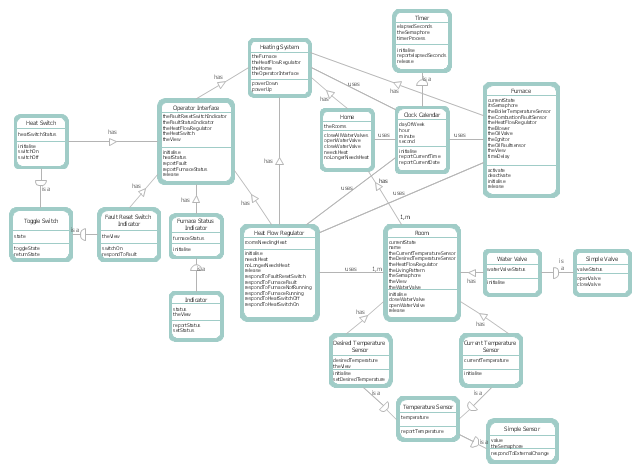
This DFD sample was created on the base of the figure illustrating "A Survey of Object-Oriented Methods" by Peter Biggs from University of Durham.
[students.cs.byu.edu/ ~pbiggs/ images/ coadsys.gif]
"Object-oriented analysis and design (OOAD) is a popular technical approach to analyzing, designing an application, system, or business by applying the object-oriented paradigm and visual modeling throughout the development life cycles to foster better stakeholder communication and product quality.
According to the popular guide Unified Process, OOAD in modern software engineering is best conducted in an iterative and incremental way. Iteration by iteration, the outputs of OOAD activities, analysis models for OOA and design models for OOD respectively, will be refined and evolve continuously driven by key factors like risks and business values." [Object-oriented analysis and design. Wikipedia]
The DFD example "Coad/ Yourdon's Object-Oriented Analysis model" was created using the ConceptDraw PRO diagramming and vector drawing software extended with the Data Flow Diagrams solution from the Software Development area of ConceptDraw Solution Park.
DFD
- Clear Symbol S Of Dfd
- Data Flow Diagrams ( DFD ) | Audio and Video Connectors ...
- Data Flow Diagram Symbols. DFD Library | Basic Flowchart ...
- Data Flow Diagrams ( DFD ) | Audio, Video, Media | How to Create a ...
- Dfd Diagram Tools On Mac
- Software To Create Dfd For Software Development
- DFD Library System | Data Flow Diagrams ( DFD ) | Process ...
- DFD - Process of account receivable | Data Flow Diagram Process ...
- How to Create a Social Media DFD Flowchart | Data Flow Diagrams ...
- Example of DFD for Online Store ( Data Flow Diagram ) DFD ...
- How to Create a Data Flow Diagram using ConceptDraw PRO | Data ...
- Design Data Flow. DFD Library | Data Flow Diagram Symbols. DFD ...
- Data Flow Diagram Process
- Data Flow Diagrams ( DFD ) | ConceptDraw Solution Park | Audio ...
- Video How To Create A Social Media Dfd Flowchart
- Data Flow Diagrams ( DFD ) | IDEF0 Diagrams | IDEF0 Flowchart ...
- How to Create a Social Media DFD Flowchart | Social Ecological ...
- State Diagram Example - Online Store | Example of DFD for Online ...
- Example of DFD for Online Store ( Data Flow Diagram ). DFD ...
- Swot Dfd In Pdf Download
- ERD | Entity Relationship Diagrams, ERD Software for Mac and Win
- Flowchart | Basic Flowchart Symbols and Meaning
- Flowchart | Flowchart Design - Symbols, Shapes, Stencils and Icons
- Flowchart | Flow Chart Symbols
- Electrical | Electrical Drawing - Wiring and Circuits Schematics
- Flowchart | Common Flowchart Symbols
- Flowchart | Common Flowchart Symbols