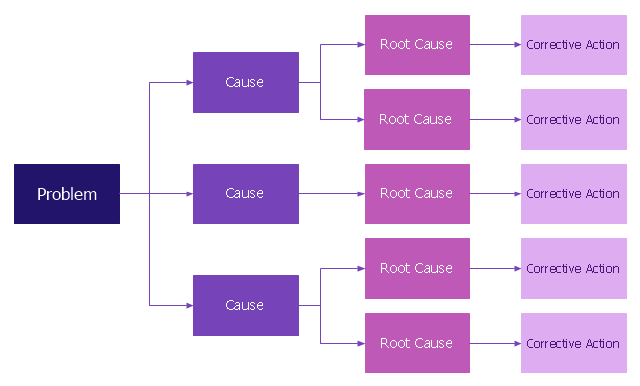
Root cause analysis (RCA) tree diagram lets identify the root causes for a factor and then list possible corrective action. The diagram displays the structure of causes for a factor and possible corrective actions. The root cause analysis tree diagram is used for further formulation of actions.
"Tree Diagram.
This tool is used to break down broad categories into finer and finer levels of detail. It can map levels of details of tasks that are required to accomplish a goal or solution or task. Developing the tree diagram helps one move their thinking from generalities to specifics." [Seven Management and Planning Tools. Wikipedia]
This root cause analysis tree diagram template for the ConceptDraw PRO diagramming and vector drawing software is included in the Seven Management and Planning Tools solution from the Management area of ConceptDraw Solution Park.
RCA diagram
HelpDesk
How To Create Root Cause Analysis Diagram Using ConceptDraw Office

Cause and Effect Analysis


"Cause-and-effect diagrams can reveal key relationships among various variables, and the possible causes provide additional insight into process behavior.
Causes can be derived from brainstorming sessions. These groups can then be labeled as categories of the fishbone. They will typically be one of the traditional categories mentioned above but may be something unique to the application in a specific case. Causes can be traced back to root causes with the 5 Whys technique." [Ishikawa diagram. Wikipedia]
"The 5 Whys is an iterative question-asking technique used to explore the cause-and-effect relationships underlying a particular problem. The primary goal of the technique is to determine the root cause of a defect or problem. (The "5" in the name derives from an empirical observation on the number of iterations typically required to resolve the problem.)" [5 Whys. Wikipedia]
This Ishikawa diagram (cause and effect diagram) template is included in the Fishbone Diagram solution from the Management area of ConceptDraw Solution Park.
Fishbone diagram

HelpDesk
How to Draw a Fishbone Diagram with ConceptDraw PRO

Affinity Diagram

Authority Matrix Diagram Software

ConceptDraw PRO extended with Seven Management and Planning Tools solution from the Management Area is the best Authority Matrix Diagram Software.
Activity Network Diagram Method

This sample shows the PERT (Program Evaluation Review Technique) chart of the request on proposal. A request for proposal (RFP) is a request of the company or the organization to potential suppliers to submit the business proposals for service or goods that it is interested to purchase. The RFP is represented on the initial procurement stage and allows to define the risks and benefits.
 Management Area
The solutions from Management area of ConceptDraw Solution Park collect templates, samples and libraries of vector stencils for drawing the management diagrams and mind maps.
PDPC

 Seven Management and Planning Tools
Seven Management and Planning Tools solution extends ConceptDraw PRO and ConceptDraw MINDMAP with features, templates, samples and libraries of vector stencils for drawing management mind maps and diagrams.
HelpDesk
How to Manage Problem Solving Using Seven Management and Planning Tools

Using Fishbone Diagrams for Problem Solving

Using Fishbone Diagrams for Problem Solving is a productive and illustrative tool to identify the most important factors causing the trouble. ConceptDraw PRO extended with Fishbone Diagrams solution from the Management area of ConceptDraw Solution Park is a powerful tool for problem solving with Fishbone Ishikawa diagram graphic method.
- Root cause analysis tree diagram - Template | Fault Tree Analysis ...
- PROBLEM ANALYSIS . Root Cause Analysis Tree Diagram | How To ...
- PROBLEM ANALYSIS . Root Cause Analysis Tree Diagram | Root ...
- Manufacturing 8 Ms fishbone diagram - Template | Business ...
- Root cause analysis tree diagram - Template
- Root Cause Analysis tree diagram template | Cause & Effect ...
- Cause And Effect Of Manufacturing
- Root cause analysis tree diagram template
- Value-Stream Mapping for Manufacturing | Business Productivity ...
- Cause and Effect Analysis (Fishbone Diagrams ) | Cause and Effect ...
- Root cause analysis tree diagram - Manufacturing problem solution ...
- Root cause analysis tree diagram - Template
- Fault Tree Analysis Diagrams | Root cause analysis tree diagram ...
- PROBLEM ANALYSIS . Root Cause Analysis Tree Diagram | Cause ...
- Fault Tree Analysis Diagrams | Root cause analysis tree diagram ...
- PROBLEM ANALYSIS Root Cause Analysis Tree Diagram | Seven ...
- Root cause analysis tree diagram template | Cause & Effect Analysis ...
- PROBLEM ANALYSIS . Root Cause Analysis Tree Diagram ...
- Cause And Effect Analysis Example
- Seven Management and Planning Tools | PROBLEM ANALYSIS ...
- ERD | Entity Relationship Diagrams, ERD Software for Mac and Win
- Flowchart | Basic Flowchart Symbols and Meaning
- Flowchart | Flowchart Design - Symbols, Shapes, Stencils and Icons
- Flowchart | Flow Chart Symbols
- Electrical | Electrical Drawing - Wiring and Circuits Schematics
- Flowchart | Common Flowchart Symbols
- Flowchart | Common Flowchart Symbols