 ConceptDraw Solution Park
ConceptDraw Solution Park collects graphic extensions, examples and learning materials
Brilliant Examples of Infographics Map, Transport, Road
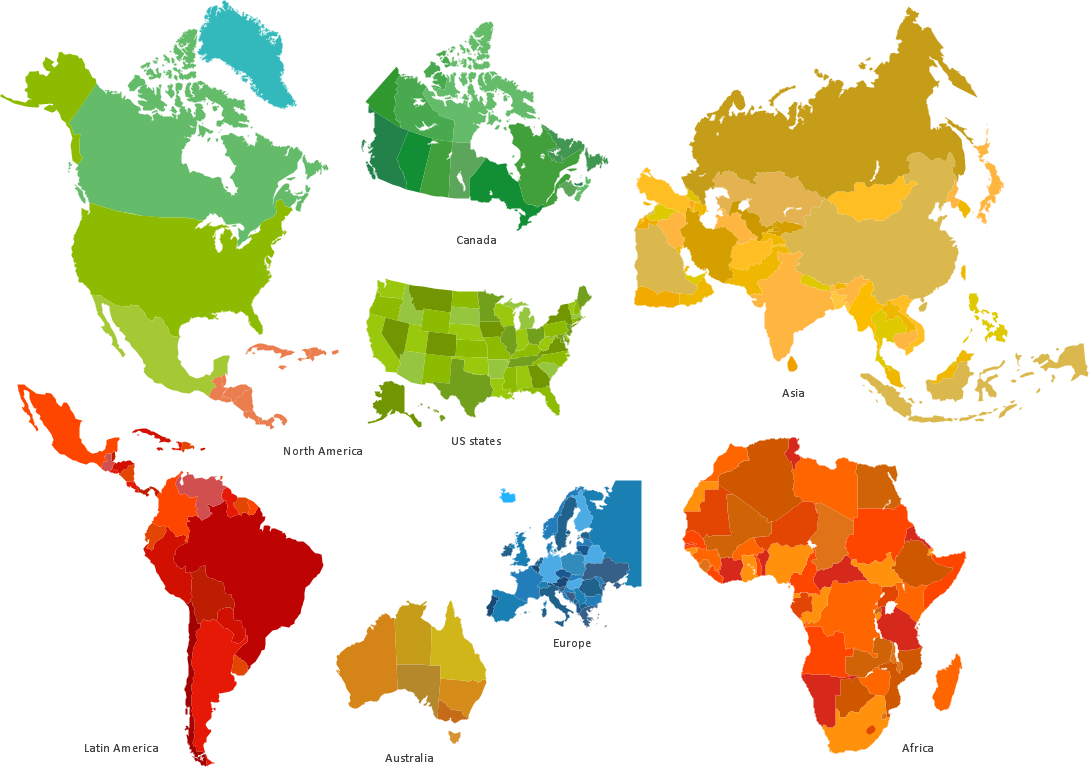
ConceptDraw PRO contains spatial infographics samples, map templates to be filled in, and libraries of vector stencils for main design elements of spatial infographics.
 Directional Maps
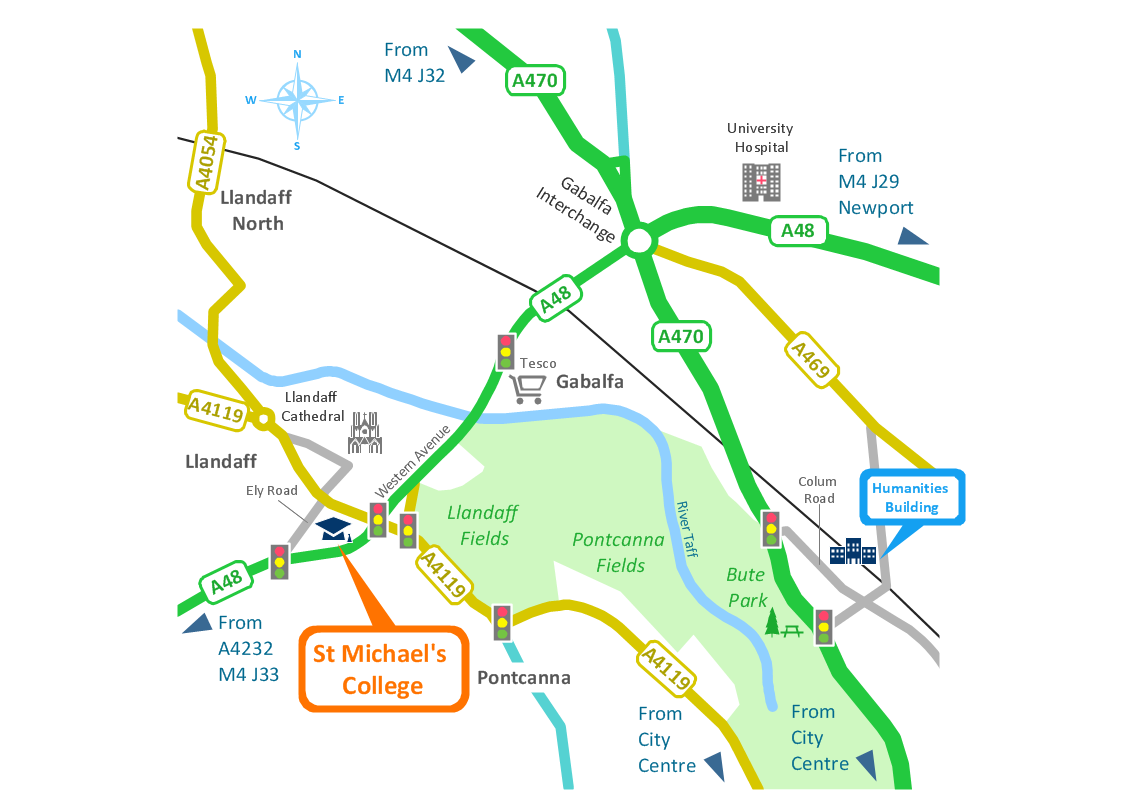
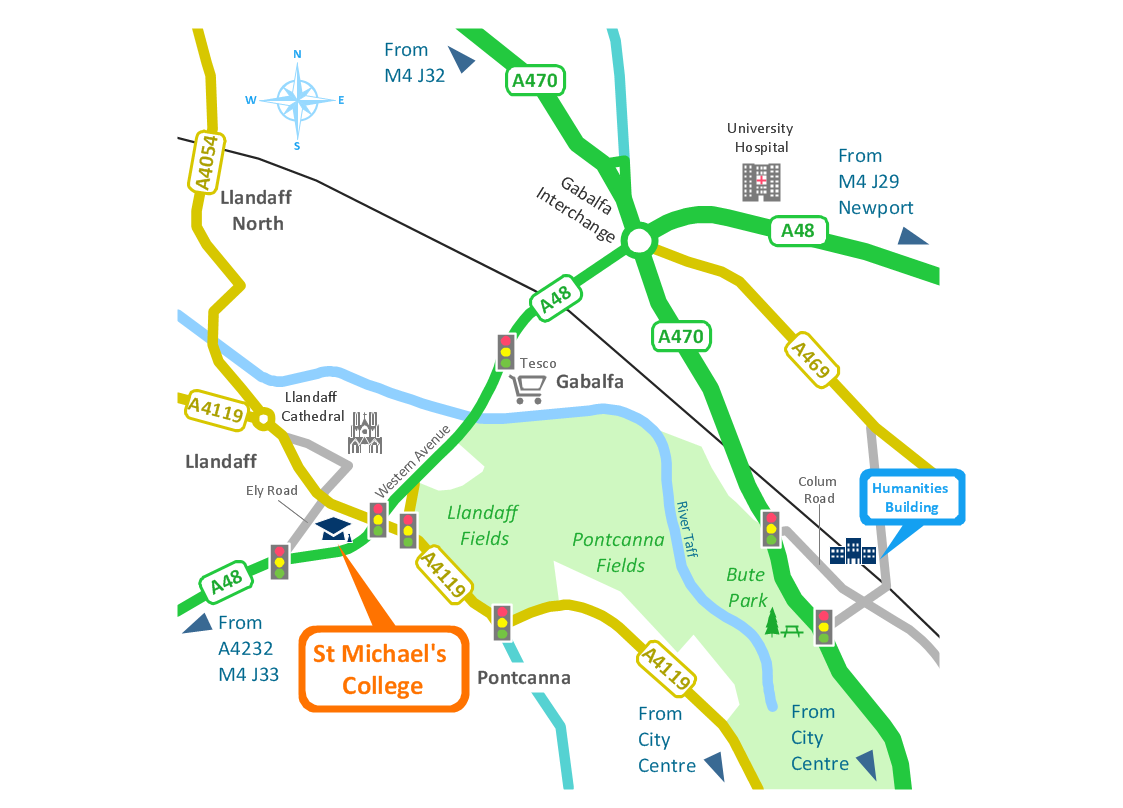
Directional Maps solution extends ConceptDraw PRO software with templates, samples and libraries of vector stencils for drawing the directional, location, site, transit, road and route maps, plans and schemes.
Map Infographic Tool
ConceptDraw is a data visualization tool, which can help you to create a map infographics. Anyone can do this, it's that easy!Spatial infographics Design Elements: Location Map
Infographic Design Elements for visually present various geographically distributed information.Best Tool for Infographic Construction
ConceptDraw is a best data visualization tool that will allow everyone to create rich infographics and visualizations quickly and easily.Infographics and Maps
ConceptDraw is a tool that produces colorful infographics.
 Maps Area
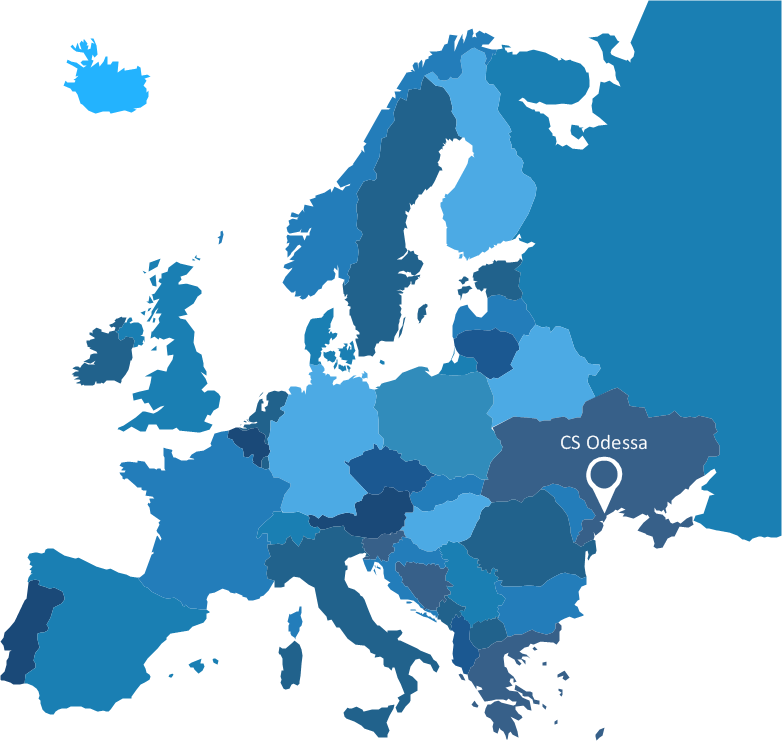
Solutions from the Maps Area of ConceptDraw Solution Park collect templates, samples and libraries of vector stencils for drawing geographical, directional and transport maps.
Visualization Spatial Data Using Thematic Maps Combined with Infographics
Now anyone can build an infographics from their data using ConceptDraw.Nice and simple, but the features it have are power-packed!
Tools to Create Your Own Infographics
Over the past few centuries, data visualization has evolved so much that we use it every day in all areas of our lives. Many believe that infographic is an effective tool of storytelling, as well as analytics, and that it is able to overcome most of the language and educational barriers. Understanding the mechanisms of human perception will help you to understand how abstract forms and colors used in data visualization can transmit information more efficient than long paragraphs of text.- The 100th Tour de France - Route map | 2D Directional map ...
- Map symbols - Vector stencils library | Design elements - Location ...
- Maps | Transportation Infographics | How to draw Metro Map style ...
- Design elements - Road signs | Maps | Directional Maps ...
- Design elements - Road signs
- Infographic design elements, software tools Subway and Metro style ...
- Road Transport - Design Elements | Design elements - Road ...
- Directional Maps | 3D pictorial road map | Examples of Flowcharts ...
- Design elements - Landmarks | Design elements - Location map ...
- 3D directional maps
- ConceptDraw Solution Park | Aerospace and Transport | Metro Map ...
- Maps | Map Infographic Creator | Brilliant Examples of Infographics ...
- ConceptDraw PRO Compatibility with MS Visio | Comparing ...
- Directional Map
- Design elements - Roads and junctions, Subway and train | Rail ...
- ConceptDraw Solution Park | Value Stream Mapping | Metro Map ...
- Maps | Spatial Infographics | Design elements - 3D directional maps ...
- Rail transport - Design elements - Conceptdraw.com
- Landmarks - Vector stencils library | Design elements - Location ...
- Infographic design elements, software tools Subway and Metro style ...
- ERD | Entity Relationship Diagrams, ERD Software for Mac and Win
- Flowchart | Basic Flowchart Symbols and Meaning
- Flowchart | Flowchart Design - Symbols, Shapes, Stencils and Icons
- Flowchart | Flow Chart Symbols
- Electrical | Electrical Drawing - Wiring and Circuits Schematics
- Flowchart | Common Flowchart Symbols
- Flowchart | Common Flowchart Symbols


