Business diagrams & Org Charts with ConceptDraw DIAGRAM


The accident analysis diagram example "Accident analytic tree" was redesigned from the picture 7-14 from the "DOE Workbook. Conducting Accident Investigations. Revision 2."
"Analytic tree analyses are well defined, useful methods that graphically depict, from beginning to end, the events and conditions preceding and immediately following an accident. An analytic tree is a means of organizing information that helps the investigator conduct a deductive analysis of any system (human, equipment, or environmental) to determine critical paths of success and failure. Results from this analysis identify the details and interrelationships that must be considered to prevent the oversights, errors, and omissions that lead to failures. In accident investigations, this type of analysis can consist of both failure paths and success paths, and can lead to neutral, negative, or positive conclusions regarding accident severity.
TIP.
An analytic tree enables the user to:
(1) Systematically identify the possible paths from events to outcome.
(2) Display a graphical record of the analytical process.
(3) Identify management system weaknesses and strengths."
[homer.ornl.gov/ sesa/ corporatesafety/ aip/ docs/ workbook/ Rev2/ chpt7/ chapt7.htm]
The FTA diagram example "Accident analytic tree" was created using the ConceptDraw PRO diagramming and vector drawing software extended with the Fault Tree Analysis Diagrams solution from the Engineering area of ConceptDraw Solution Park.
FTA diagram

Professional Diagram and Flowchart Software

Flow Chart Symbols

Pyramid Diagram

3D triangular diagram of DIKW pyramid has 6 levels: measurement, facts, data, information, knowledge, wisdom.
The data component include different scattered signs or symbols which are merely useless until these random objective facts are somehow processed. Data is a resource which has to be manipulated or rearranged to get useful. Information can be extracted from a pile of data, it also can be mined from different data storages.
Sales Process Steps

Sales Process

Sales Process Flowcharts

Six Markets Model Chart

The six markets model defines six markets that take the central place in the relationship marketing: internal markets, supplier markets, recruitment markets, referral markets, influence markets and customer markets. The six markets model allows the organization to analyze the stakeholders and key market domains that can be important to it.
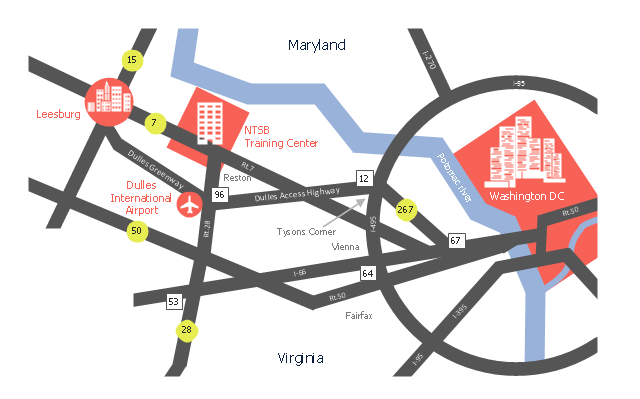
This location map sample was created on the base of the location map from the website of the NTSB Training Center.
"The NTSB Training Center is the training facility for the National Transportation Safety Board, an independent federal agency that investigates all civil aviation accidents in the United States and selected accidents in other modes of transportation.
The Training Center provides training for NTSB investigators and others from the transportation community to improve their practice of accident investigation techniques. The curriculum promotes independent, objective, and technically advanced accident investigations that will enhance the safety of all modes of transportation. ... Located on the Virginia campus of The George Washington University in Ashburn, the Training Center is ten miles from Washington Dulles Airport and 30 miles from Washington, D.C. Driving directions, maps, and a link to the virtual tour of our facility are available on the Campus page." [ntsb.gov/ trainingcenter/ about.htm]
The location map example "NTSB Training Center location" was created using the ConceptDraw PRO diagramming and vector drawing software extended with the Directional Maps solution from the Maps area of ConceptDraw Solution Park.
Location map
- Traffic Accident Drawing
- FTA diagram - Hazard analysis | Accident analytic tree - FTA ...
- Car Accident Diagram
- Accident analytic tree - FTA diagram | Fault Tree Diagram | Fault ...
- Fta Of Car Accident Example
- Accident analytic tree - FTA diagram | Car Accident Drawing
- Accident Diagram Car Template
- Accident analytic tree - FTA diagram | Fault Tree Analysis Diagrams ...
- Fault Tree Analysis For Car Accident
- How to Create a Fault Tree Analysis Diagram (FTD) in ConceptDraw ...
- ERD | Entity Relationship Diagrams, ERD Software for Mac and Win
- Flowchart | Basic Flowchart Symbols and Meaning
- Flowchart | Flowchart Design - Symbols, Shapes, Stencils and Icons
- Flowchart | Flow Chart Symbols
- Electrical | Electrical Drawing - Wiring and Circuits Schematics
- Flowchart | Common Flowchart Symbols
- Flowchart | Common Flowchart Symbols