"Trade, also called goods exchange economy, is to transfer the ownership of goods from one person or entity to another by getting something in exchange from the buyer. Trade is sometimes loosely called commerce or financial transaction or barter. A network that allows trade is called a market. ...
Modern traders ... generally negotiate through a medium of exchange, such as money. As a result, buying can be separated from selling, or earning. ...
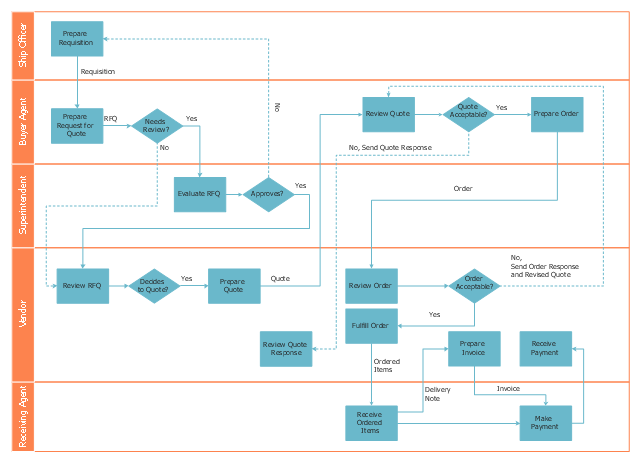
Retail trade consists of the sale of goods or merchandise from a very fixed location, such as a department store, boutique or kiosk, or by mail, in small or individual lots for direct consumption by the purchaser. Wholesale trade is defined as the sale of goods that are sold merchandise to retailers, to industrial, commercial, institutional, or other professional business users, or to other wholesalers and related subordinated services." [Trade. Wikipedia]
The deployment flow chart example "Trading process diagram" was created using the ConceptDraw PRO diagramming and vector drawing software extended with the Cross-Functional Flowcharts solution from the Business Processes area of ConceptDraw Solution Park.
Modern traders ... generally negotiate through a medium of exchange, such as money. As a result, buying can be separated from selling, or earning. ...
Retail trade consists of the sale of goods or merchandise from a very fixed location, such as a department store, boutique or kiosk, or by mail, in small or individual lots for direct consumption by the purchaser. Wholesale trade is defined as the sale of goods that are sold merchandise to retailers, to industrial, commercial, institutional, or other professional business users, or to other wholesalers and related subordinated services." [Trade. Wikipedia]
The deployment flow chart example "Trading process diagram" was created using the ConceptDraw PRO diagramming and vector drawing software extended with the Cross-Functional Flowcharts solution from the Business Processes area of ConceptDraw Solution Park.
Deployment flowchart
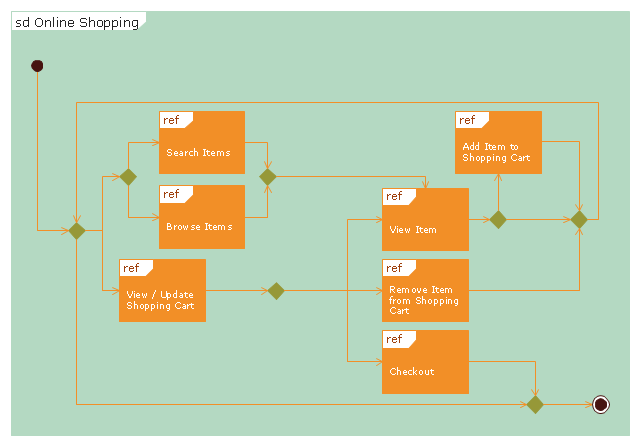
"Online shopping or e-shopping is a form of electronic commerce which allows consumers to directly buy goods or services from a seller over the Internet using a web browser. Alternative names are: e-web-store, e-shop, e-store, Internet shop, web-shop, web-store, online store, online storefront and virtual store. Mobile commerce (or m-commerce) describes purchasing from an online retailer's mobile optimized online site or app.
An online shop evokes the physical analogy of buying products or services at a bricks-and-mortar retailer or shopping center; the process is called business-to-consumer (B2C) online shopping. In the case where a business buys from another business, the process is called business-to-business (B2B) online shopping. The largest of these online retailing corporations are Alibaba, Amazon.com, and eBay. Retail success is no longer all about physical stores. This is evident because of the increase in retailers now offering online store interfaces for consumers. With the growth of online shopping, comes a wealth of new market footprint coverage opportunities for stores that can appropriately cater to offshore market demands and service requirements." [Online shopping. Wikipedia]
The UML interaction overview diagram example "Online shopping" was created using the ConceptDraw PRO diagramming and vector drawing software extended with the Rapid UML solution from the Software Development area of ConceptDraw Solution Park.
UML interaction overview diagram
 Entity-Relationship Diagram (ERD)
Entity-Relationship Diagram (ERD) solution extends ConceptDraw PRO software with templates, samples and libraries of vector stencils from drawing the ER-diagrams by Chen's and crow’s foot notations.
"Ishikawa diagrams (also called fishbone diagrams, herringbone diagrams, cause-and-effect diagrams, or Fishikawa) are causal diagrams created by Kaoru Ishikawa (1968) that show the causes of a specific event. Common uses of the Ishikawa diagram are product design and quality defect prevention, to identify potential factors causing an overall effect. Each cause or reason for imperfection is a source of variation. Causes are usually grouped into major categories to identify these sources of variation. The categories typically include:
- People: Anyone involved with the process
- Methods: How the process is performed and the specific requirements for doing it, such as policies, procedures, rules, regulations and laws
- Machines: Any equipment, computers, tools, etc. required to accomplish the job
- Materials: Raw materials, parts, pens, paper, etc. used to produce the final product
- Measurements: Data generated from the process that are used to evaluate its quality
- Environment: The conditions, such as location, time, temperature, and culture in which the process operates" [Ishikawa diagram. Wikipedia]
The fishbone diagram example "Causes of low-quality output" was created using the ConceptDraw PRO diagramming and vector drawing software extended with the Fishbone Diagrams solution from the Management area of ConceptDraw Solution Park.
Ishikawa diagram

- Trading process diagram - Deployment flowchart | Cross-Functional ...
- Retail Process Flow Chart
- Planogram Software and Retail Plan Software | Trading process ...
- Workflow Diagrams Of Retail Stores
- Trading process diagram - Deployment flowchart
- B2b Process Diagram
- Retail Management Charts And Diagram
- Retail Management Diagram
- Trading process diagram - Deployment flowchart | Trading process ...
- Workflow Diagram Of Business Retail
- Retail Store Flowchart Process Diagram
- Retail Flow Diagram
- Flow Charts To Explain Retail Business Process
- Process Flowchart | Meaning Of Retail Banking With Diagram
- Trading process diagram - Deployment flowchart | Flow chart ...
- Diagram Of Retail Management
- Retail Workflow Diagram
- Process Flowchart | Types of Flowchart - Overview | Cross ...
- Planogram Software and Retail Plan Software | Process Flowchart ...
- Trading process diagram - Deployment flowchart | Store Layout ...
- ERD | Entity Relationship Diagrams, ERD Software for Mac and Win
- Flowchart | Basic Flowchart Symbols and Meaning
- Flowchart | Flowchart Design - Symbols, Shapes, Stencils and Icons
- Flowchart | Flow Chart Symbols
- Electrical | Electrical Drawing - Wiring and Circuits Schematics
- Flowchart | Common Flowchart Symbols
- Flowchart | Common Flowchart Symbols