Basic Network Diagram


 Block Diagrams
Block diagrams solution extends ConceptDraw DIAGRAM software with templates, samples and libraries of vector stencils for drawing the block diagrams.
"Bars categorized by the kind of entertainment they offer include:
(1) Blues bars, specializing in the live blues style of music.
(2) Comedy Bar specializing in a stand-up comedy entertainment.
(3) Dance bars, which have a dance floor where patrons dance to recorded music.
(4) But if a dance bar has a large dance floor and hires well-known professional DJs, it is considered to be a nightclub or discothèque.
(5) Karaoke bars, with nightly karaoke as entertainment.
(6) Music bars, specializing in live music (i.e. concerts).
(7) Drag bars, which have live shows, where men dress as women and generally lip-sync to recordings of female vocal artists; often with hilarious results.
(8) Salsa bars, where patrons dance to Latin salsa music.
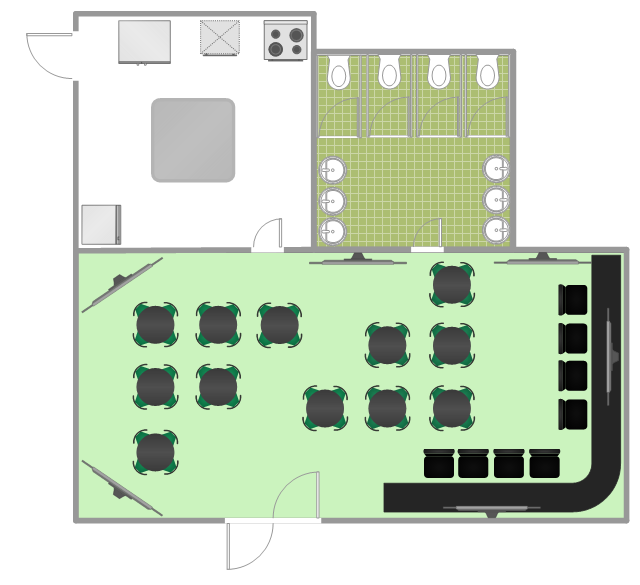
(9) Sports bars, where sports fans watch games on large-screen televisions.
(10) Topless bars, where topless female employees dance or serve drinks." [Bar (establishment). Wikipedia]
The floor plan example "Sports bar" was created using the ConceptDraw PRO diagramming and vector drawing software extended with the Cafe and Restaurant solution from the Building Plans area of ConceptDraw Solution Park.
(1) Blues bars, specializing in the live blues style of music.
(2) Comedy Bar specializing in a stand-up comedy entertainment.
(3) Dance bars, which have a dance floor where patrons dance to recorded music.
(4) But if a dance bar has a large dance floor and hires well-known professional DJs, it is considered to be a nightclub or discothèque.
(5) Karaoke bars, with nightly karaoke as entertainment.
(6) Music bars, specializing in live music (i.e. concerts).
(7) Drag bars, which have live shows, where men dress as women and generally lip-sync to recordings of female vocal artists; often with hilarious results.
(8) Salsa bars, where patrons dance to Latin salsa music.
(9) Sports bars, where sports fans watch games on large-screen televisions.
(10) Topless bars, where topless female employees dance or serve drinks." [Bar (establishment). Wikipedia]
The floor plan example "Sports bar" was created using the ConceptDraw PRO diagramming and vector drawing software extended with the Cafe and Restaurant solution from the Building Plans area of ConceptDraw Solution Park.
Floor plan
HelpDesk
How to Create a Bar Chart

The bar graph can be vertical or horizontal. This depends on the number of categories. There are many methods in which bar graph can be built and this makes it a very often used chart type. Usually, a bar chart is created so that the bars are placed vertically. Such an arrangement means that the bar's height value is proportional to the category value. Nevertheless, a bar chart can be also drawn horizontally. This means that the longer the bar, the bigger the category. Thus, a bar chart is a good way to present the relative values of different measured items. The ConceptDraw Bar Graphs solution allows you to draw a bar chart quickly using a vector library, containing the set of various bar charts objects.
HelpDesk
How to Draw a Histogram

 Directional Maps
Directional Maps solution extends ConceptDraw DIAGRAM software with templates, samples and libraries of vector stencils for drawing the directional, location, site, transit, road and route maps, plans and schemes.
HelpDesk
How to Draw a Pyramid Diagram

 Pyramid Diagrams
Pyramid Diagrams solution extends ConceptDraw DIAGRAM software with templates, samples and library of vector stencils for drawing the marketing pyramid diagrams.
 Bar Graphs
The Bar Graphs solution enhances ConceptDraw DIAGRAM functionality with templates, numerous professional-looking samples, and a library of vector stencils for drawing different types of Bar Graphs, such as Simple Bar Graph, Double Bar Graph, Divided Bar Graph, Horizontal Bar Graph, Vertical Bar Graph, and Column Bar Chart.
 Telecommunication Network Diagrams
Telecommunication Network Diagrams solution extends ConceptDraw DIAGRAM software with samples, templates, and great collection of vector stencils to help the specialists in a field of networks and telecommunications, as well as other users to create Computer systems networking and Telecommunication network diagrams for various fields, to organize the work of call centers, to design the GPRS networks and GPS navigational systems, mobile, satellite and hybrid communication networks, to construct the mobile TV networks and wireless broadband networks.
- How To Create Restaurant Floor Plan in Minutes | 3D Network ...
- How To Create Restaurant Floor Plan in Minutes | Free 3d Kitchen ...
- 3D pictorial street map | How To Create Restaurant Floor Plan in ...
- How To Create Restaurant Floor Plan in Minutes | Mini Restaurant ...
- How To Create Restaurant Floor Plan in Minutes | Small Cafe 3d ...
- 3D Network Diagram Software | How To Create Restaurant Floor ...
- How To Create Restaurant Floor Plan in Minutes | Block Diagrams ...
- How To Create Restaurant Floor Plan in Minutes | Network Icons ...
- How To Create Restaurant Floor Plan in Minutes | Store Layout ...
- How To Create Restaurant Floor Plan in Minutes | Directional Maps ...
- How To Create Restaurant Floor Plan in Minutes | 3d Kitchen ...
- Restaurant Table Layout Design In 3d
- How To Create Restaurant Floor Plan in Minutes | Store Layout ...
- How To Create Restaurant Floor Plan in Minutes | Cafe and ...
- How To Create Restaurant Floor Plan in Minutes | Sports bar - Floor ...
- How To Create Restaurant Floor Plan in Minutes | Network ...
- How To Create Restaurant Floor Plan in Minutes | House Elektic ...
- How To Create Restaurant Floor Plan in Minutes | Sports bar - Floor ...
- How To Create Restaurant Floor Plan in Minutes | Sports bar - Floor ...
- Pyramid Diagram | How To Create Restaurant Floor Plan in Minutes ...
- ERD | Entity Relationship Diagrams, ERD Software for Mac and Win
- Flowchart | Basic Flowchart Symbols and Meaning
- Flowchart | Flowchart Design - Symbols, Shapes, Stencils and Icons
- Flowchart | Flow Chart Symbols
- Electrical | Electrical Drawing - Wiring and Circuits Schematics
- Flowchart | Common Flowchart Symbols
- Flowchart | Common Flowchart Symbols