This example of marketing infogram was created on the base of web page "Market research" from the website of West Australian State Government agency Small Business Development Corporation (SBDC).
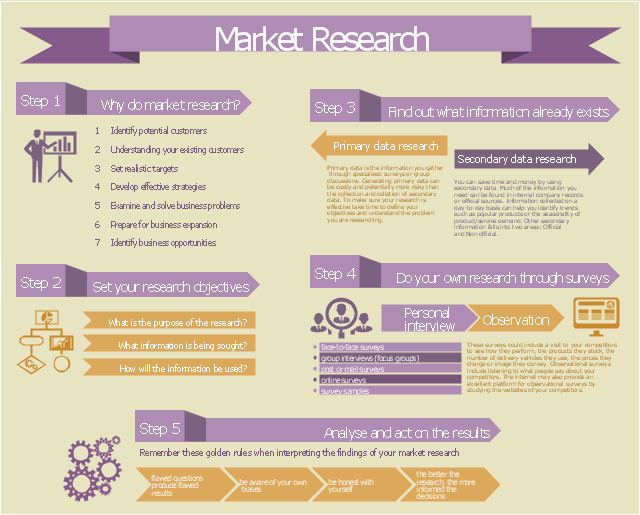
"Market research is a key part of developing your marketing strategy. It’s about collecting information to give you an insight into your customers’ mind so that you understand what they want, how they gather information and where they come from. You can also do market research to get a better idea of market trends and what is happening in your industry sector.
The information you gather and analyse builds the foundation of good business decisions whether it’s deciding what product or service you’ll offer, where your business should be located, how to distribute your products or how you communicate with consumers." [smallbusiness.wa.gov.au/ market-research]
The example "Marketing Infographics - Market Research" was created using the ConceptDraw PRO diagramming and vector drawing software extended with the Marketing Infographics solition from the area "Business Infographics" in ConceptDraw Solution Park.
Marketing infogram
This circle diagram sample was redesigned from the Wikimedia Commons file: Research cycle.png. "Some of the basic elements of the scientific method, arranged in a cycle to emphasize that it is an iterative process." [commons.wikimedia.org/ wiki/ File:Research_ cycle.png]
This file is licensed under the Creative Commons Attribution 2.0 Generic license. [creativecommons.org/ licenses/ by/ 2.0/ deed.en]
"The scientific method is a body of techniques for investigating phenomena, acquiring new knowledge, or correcting and integrating previous knowledge. To be termed scientific, a method of inquiry must be based on empirical and measurable evidence subject to specific principles of reasoning. ...
Four essential elements of the scientific method are iterations, recursions, interleavings, or orderings of the following:
(1) Characterizations (observations, definitions, and measurements of the subject of inquiry).
(2) Hypotheses (theoretical, hypothetical explanations of observations and measurements of the subject).
(3) Predictions (reasoning including logical deduction from the hypothesis or theory).
(4) Experiments (tests of all of the above)...
A linearized, pragmatic scheme of the four points above is sometimes offered as a guideline for proceeding:
(1) Define a question.
(2) Gather information and resources (observe).
(3) Form an explanatory hypothesis.
(4) Test the hypothesis by performing an experiment and collecting data in a reproducible manner.
(5) Analyze the data.
(6) Interpret the data and draw conclusions that serve as a starting point for new hypothesis.
(7) Publish results.
(8) Retest (frequently done by other scientists).
The iterative cycle inherent in this step-by-step method goes from point 3 to 6 back to 3 again." [Scientific method. Wikipedia]
The circle diagram example "Research cycle" was created using the ConceptDraw PRO diagramming and vector drawing software extended with the Target and Circular Diagrams solution from the Marketing area of ConceptDraw Solution Park.
www.conceptdraw.com/ solution-park/ marketing-target-and-circular-diagrams
Circle diagram

Best Program to Make Workflow Diagrams

This arrow loop cycle diagram sample was created on the base of the figure illustrating the webpage "Exploratory Advanced Research Program Hand-Off Workshops" from the US Department of Transportation - Federal Highway Administration (FHWA) website. "The FHWA’s research and technology innovation life cycle illustrates that research and technology development are not insular activities, but integrated processes that together constitute a system.
Following general workshop discussion, a number of common issues emerged among the groups. These centered around the research life cycle, communicating the value of exploratory advanced research, and continued project funding. It was felt that there is a general need to better describe the research and deployment cycle specific to highway transportation and possibly to highway research fields, such as materials or system planning. Research life cycle diagrams show a very linear, chronological process but it is not necessarily that way in reality." [fhwa.dot.gov/ advancedresearch/ pubs/ 11034/ ]
The arrow loop diagram example "Innovation life cycle" was created using the ConceptDraw PRO diagramming and vector drawing software extended with the Target and Circular Diagrams solution from the Marketing area of ConceptDraw Solution Park.
www.conceptdraw.com/ solution-park/ marketing-target-and-circular-diagrams
Arrow loop cycle diagram
Tool for Workgroup Briefings, Meetings and Decisions


The vector stencils library "Management pictograms" contains 72 management pictograms.
Use it to create your management infogram in the ConceptDraw PRO diagramming and vector drawing software.
The flat icons example "Management pictograms - Vector stencils library" is included in the solution "Marketing infographics" from the "Business infographics" area of ConceptDraw Solution Park.
Use it to create your management infogram in the ConceptDraw PRO diagramming and vector drawing software.
The flat icons example "Management pictograms - Vector stencils library" is included in the solution "Marketing infographics" from the "Business infographics" area of ConceptDraw Solution Park.
Accounting management

Activity

Audit management

Board of directors

Budget

Business managemen

Business management tools

Business model

Commanding

Communication

Company

Contract management

Controlling

Coordinating

Core competencies

Corporate strategy

Creativity

Crisis management

Crisis management 2

Decision making

Environmental management

Expenses

External environment

Financial management

Financial management 2

Financial planning

First-level manager

Goal

HR management

Investment management

IT management

Knowledge management

Knowledge management 2

Leadership

Macro environment

Management system

Managerial accounting

Manufacturing management

Market orientation

Marketing management

Marketing strategy

Middle-level manager

Mission

Objectives

Operations management

Organizing

Performance

Performance management

Planning

Policy

PR management

Problem solving

Process management

Product management

Profit

Profit 2

Project management

Quality management

Research and development

Resource management

Resources

Risk management

Sales manegment

Service management

Stakeholder management

Strategic management

Strategic planning

Technology management

Time frame

Time management

Top-level manager

Vision

The vector clipart library "Presentation design elements" contains 45 presentation symbols and arrows which you can easy use in your slides and illustrations.
"A presentation is the process of presenting a topic to an audience. It is typically a demonstration, lecture, or speech meant to inform, persuade, or build good will. ... the use of visuals reduced meeting times... audiences believe presenters who use visuals are more professional and credible than presenters who merely speak. ... meetings and presentations reinforced with visuals help participants reach decisions and consensus more quickly." [Presentation. Wikipedia]
The clip art example "Presentation design elements - Vector clipart library" was created in the ConceptDraw PRO diagramming and vector drawing software using the Presentation Clipart solution from the Illustration area of ConceptDraw Solution Park.
Advance Direction Sign

Circuit

Growth

Master Link

Comparison

Plus

Minus

Multiplication

Division

Loupe

Plus sign

Minus sign

Pros and Cons

Balance Lever

Balance

Scientific Research

Business People

Hand

Financial Growth

Wallet

Increase

Decrease

Clock

Mechanism

Interaction

Small Company

Big Company

Company Expansion

Foreign Market Entry

Time

Close Cooperation

Company

Company Merger

Company Extension

Foreign Market Penetration

Business Relations

Profits

Frame 1

Frame 2

Background 1

Background 2

Background 3

Background 4

Background 5

Title block

How To Conduct Effective Team Briefings

Process Flowchart


This example is based on the organizational chart from the Ohio State University website. [osu.edu/ vpsearch/ images/ University_ Org_ Chart.png]
"The Ohio State University, a multi-campus land grant institution with an international presence, is a world-class public research university and the leading comprehensive teaching and research institution in the state, Ohio's flagship university. Ohio State provides a distinctive educational experience for students and pursues cutting-edge interdisciplinary research that brings together scholars from diverse disciplines to solve key problems in society.
One of the University's core values is to "ignite a lifelong love of learning" in students. Ohio State students benefit from a scholarly environment in which research inspires and informs teaching.
The Vice President for Student Life provides vision, leadership, and strategic direction to the Office of Student Life, a comprehensive unit dedicated to supporting the educational mission of the University and promoting the best possible overall experience for the diverse student body of approximately 60,000. The Office of Student Life supports every aspect of Ohio State students experience. Its scope includes housing, campus dining, disability services, the multicultural center, counseling and health services, student organizations and leadership development, and other related operations." [osu.edu/ vpsearch/ ]
The organizational chart example "University leadership" was created using the ConceptDraw PRO diagramming and vector drawing software extended with the Organizational Charts solution from the Management area of ConceptDraw Solution Park.
Organizational chart - University leadership

Creating a default presentation in ConceptDraw MINDMAP

Competitor Analysis

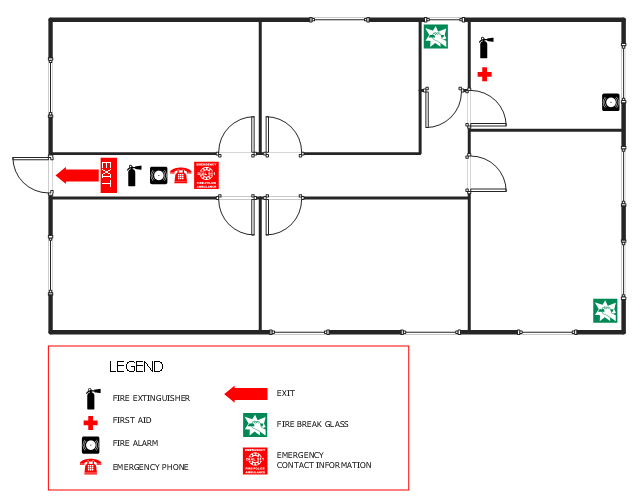
This office fire escape floor plan example shows layout of firefighting equipment and scheme of evacuation ways.
"Fire protection is the study and practice of mitigating the unwanted effects of potentially destructive fires. It involves the study of the behaviour, compartmentalisation, suppression and investigation of fire and its related emergencies, as well as the research and development, production, testing and application of mitigating systems. In structures, be they land-based, offshore or even ships, the owners and operators are responsible to maintain their facilities in accordance with a design-basis that is rooted in laws, including the local building code and fire code, which are enforced by the Authority Having Jurisdiction. Buildings must be constructed in accordance with the version of the building code that is in effect when an application for a building permit is made. Building inspectors check on compliance of a building under construction with the building code. Once construction is complete, a building must be maintained in accordance with the current fire code, which is enforced by the fire prevention officers of a local fire department. In the event of fire emergencies, Firefighters, fire investigators, and other fire prevention personnel called to mitigate, investigate and learn from the damage of a fire. Lessons learned from fires are applied to the authoring of both building codes and fire codes." [Fire protection. Wikipedia]
The example "Office fire and emergency plan" was created using the ConceptDraw PRO diagramming and vector drawing software extended with the Fire and Emergency Plans solution from the Building Plans area of ConceptDraw Solution Park.
Fire escape plan
Create a Basic Presentation Quickly

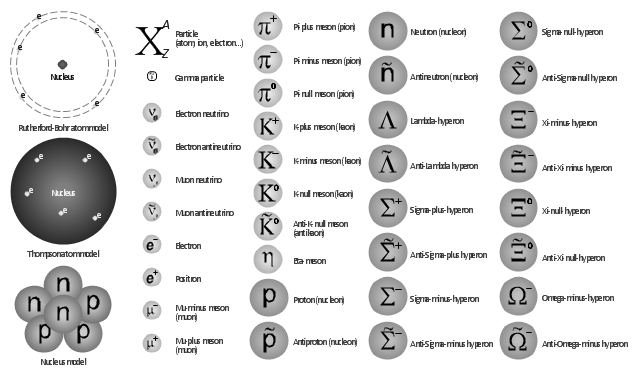
The vector shapes library "Nuclear physics" contains 39 symbol icons of elementary particles for drawing diagrams of nuclear reactions and experiments in nuclear physics.
"Nuclear physics is the field of physics that studies the constituents and interactions of atomic nuclei. The most commonly known applications of nuclear physics are nuclear power generation and nuclear weapons technology, but the research has provided application in many fields, including those in nuclear medicine and magnetic resonance imaging, ion implantation in materials engineering, and radiocarbon dating in geology and archaeology.
The field of particle physics evolved out of nuclear physics and is typically taught in close association with nuclear physics." [Nuclear physics. Wikipedia]
The example "Design elements - Nuclear physics" was created using the ConceptDraw PRO diagramming and vector drawing software extended with the Physics solution from the Science and Education area of ConceptDraw Solution Park.
Elementary particles
- Research cycle - Circle diagram | Best Program to Make Workflow ...
- Research cycle - Circle diagram | Innovation life cycle - Arrow loop ...
- Market Research Flow Chart
- A Research Analysis Diagram
- What Is The Research Onion
- Target and Circular Diagrams | Research cycle - Circle diagram ...
- Role Of Computers In Solving Operational Research Problems
- Flow Chart Of Market Research Process In Sa
- Using A Fully Labelled Flowchart Illustrate The Marketing Research
- Research cycle - Circle diagram | Export from ConceptDraw PRO ...
- Example Flow Chart Of The Values Of Research To Man
- Fully Labled Flowchart That Illustrates The Marketing Research
- Research cycle - Circle diagram | 3 Circle Venn Diagram. Venn ...
- Research Onion Diagrams
- Software To Draw Drawings For Research
- Marketing infographics - Market research
- Research cycle - Circle diagram
- Gantt Chart Psychology Research
- Process Flowchart | Tips To Make Tree Diagram Operational Research
- Target and Circular Diagrams | Circular Arrows Diagrams ...
- ERD | Entity Relationship Diagrams, ERD Software for Mac and Win
- Flowchart | Basic Flowchart Symbols and Meaning
- Flowchart | Flowchart Design - Symbols, Shapes, Stencils and Icons
- Flowchart | Flow Chart Symbols
- Electrical | Electrical Drawing - Wiring and Circuits Schematics
- Flowchart | Common Flowchart Symbols
- Flowchart | Common Flowchart Symbols