"The RFP presents preliminary requirements for the commodity or service, and may dictate to varying degrees the exact structure and format of the supplier's response. Effective RFPs typically reflect the strategy and short/ long-term business objectives, providing detailed insight upon which suppliers will be able to offer a matching perspective. ...
RFP:
(1) informs suppliers that an organization is looking to procure and encourages them to make their best effort.
(2) requires the company to specify what it proposes to purchase. If the requirements analysis has been prepared properly, it can be incorporated quite easily into the Request document.
(3) alerts suppliers that the selection process is competitive.
(4) allows for wide distribution and response.
(5) ensures that suppliers respond factually to the identified requirements.
(6) is generally expected to follow a structured evaluation and selection procedure, so that an organization can demonstrate impartiality - a crucial factor in public sector procurements." [Request for proposal. Wikipedia]
The project plan timeline diagram example "Request for proposal (RFP)" was created using the ConceptDraw PRO diagramming and vector drawing software extended with the Timeline Diagrams solution from the Management area of ConceptDraw Solution Park.
Project timeline
.png--diagram-flowchart-example.png)
Activity Network Diagram Method

This sample shows the PERT (Program Evaluation Review Technique) chart of the request on proposal. A request for proposal (RFP) is a request of the company or the organization to potential suppliers to submit the business proposals for service or goods that it is interested to purchase. The RFP is represented on the initial procurement stage and allows to define the risks and benefits.
"A request for proposal (RFP) is a solicitation made, often through a bidding process, by an agency or company interested in procurement of a commodity, service or valuable asset, to potential suppliers to submit business proposals. It is submitted early in the procurement cycle, either at the preliminary study, or procurement stage. The RFP process brings structure to the procurement decision and is meant to allow the risks and benefits to be identified clearly up front.
The RFP presents preliminary requirements for the commodity or service, and may dictate to varying degrees the exact structure and format of the supplier's response. Effective RFPs typically reflect the strategy and short/ long-term business objectives, providing detailed insight upon which suppliers will be able to offer a matching perspective.
Similar requests include a request for quotation and a request for information.
In principle, an RFP:
(1) informs suppliers that an organization is looking to procure and encourages them to make their best effort.
(2) requires the company to specify what it proposes to purchase. If the requirements analysis has been prepared properly, it can be incorporated quite easily into the Request document.
(3) alerts suppliers that the selection process is competitive.
(4) allows for wide distribution and response.
(5) ensures that suppliers respond factually to the identified requirements.
(6) is generally expected to follow a structured evaluation and selection procedure, so that an organization can demonstrate impartiality - a crucial factor in public sector procurements." [Request for proposal. Wikipedia]
The PERT chart example "Request for proposal (RFP)" was created using the ConceptDraw PRO diagramming and vector drawing software extended with the solution Seven Management and Planning Tools from the Management area of ConceptDraw Solution Park.
PERT
.png--diagram-flowchart-example.png)
Legend
.png--diagram-flowchart-example.png)
"The RFP presents preliminary requirements for the commodity or service, and may dictate to varying degrees the exact structure and format of the supplier's response. Effective RFPs typically reflect the strategy and short/ long-term business objectives, providing detailed insight upon which suppliers will be able to offer a matching perspective. ...
RFP:
(1) informs suppliers that an organization is looking to procure and encourages them to make their best effort.
(2) requires the company to specify what it proposes to purchase. If the requirements analysis has been prepared properly, it can be incorporated quite easily into the Request document.
(3) alerts suppliers that the selection process is competitive.
(4) allows for wide distribution and response.
(5) ensures that suppliers respond factually to the identified requirements.
(6) is generally expected to follow a structured evaluation and selection procedure, so that an organization can demonstrate impartiality - a crucial factor in public sector procurements." [Request for proposal. Wikipedia]
The project plan timeline diagram example "Request for proposal (RFP)" was created using the ConceptDraw PRO diagramming and vector drawing software extended with the Timeline Diagrams solution from the Management area of ConceptDraw Solution Park.
RFP:
(1) informs suppliers that an organization is looking to procure and encourages them to make their best effort.
(2) requires the company to specify what it proposes to purchase. If the requirements analysis has been prepared properly, it can be incorporated quite easily into the Request document.
(3) alerts suppliers that the selection process is competitive.
(4) allows for wide distribution and response.
(5) ensures that suppliers respond factually to the identified requirements.
(6) is generally expected to follow a structured evaluation and selection procedure, so that an organization can demonstrate impartiality - a crucial factor in public sector procurements." [Request for proposal. Wikipedia]
The project plan timeline diagram example "Request for proposal (RFP)" was created using the ConceptDraw PRO diagramming and vector drawing software extended with the Timeline Diagrams solution from the Management area of ConceptDraw Solution Park.
Project timeline
Timeline Diagrams

ConceptDraw DIAGRAM extended with Timeline Diagrams solution from the Management area of ConceptDraw Solution Park is a powerful software for fast and easy drawing useful and great-looking timeline diagrams.
Program Evaluation and Review Technique (PERT) with ConceptDraw DIAGRAM
 with ConceptDraw DIAGRAM *")
ConceptDraw PROJECT Software Overview

 Timeline Diagrams
Timeline Diagrams solution extends ConceptDraw DIAGRAM diagramming software with samples, templates and libraries of specially developed smart vector design elements of timeline bars, time intervals, milestones, events, today marker, legend, and many other elements with custom properties, helpful for professional drawing clear and intuitive Timeline Diagrams. Use it to design simple Timeline Diagrams and designate only the main project stages, or highly detailed Timeline Diagrams depicting all project tasks, subtasks, milestones, deadlines, responsible persons and other description information, ideal for applying in presentations, reports, education materials, and other documentation.
PERT Chart

 Seven Management and Planning Tools
Seven Management and Planning Tools solution extends ConceptDraw DIAGRAM and ConceptDraw MINDMAP with features, templates, samples and libraries of vector stencils for drawing management mind maps and diagrams.
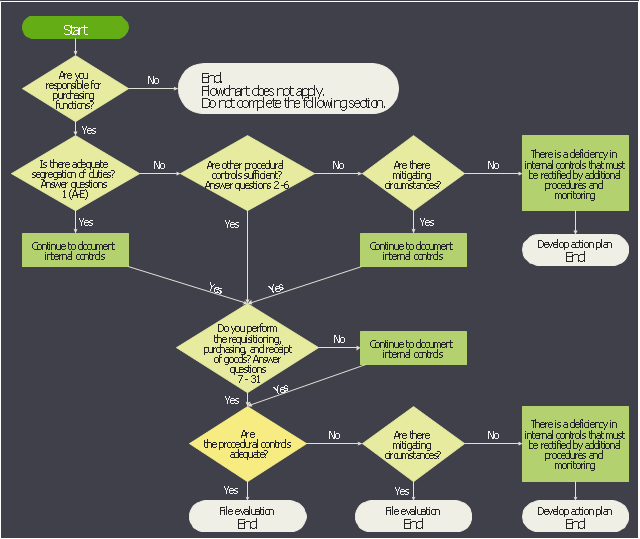
This accounting flowchart example was created on the base of the figure from the website of the Office of the State Comptroller. [osc.ct.gov/ manuals/ acctdirect/ question03.htm]
"Purchasing is the formal process of buying goods and services. The purchasing process can vary from one organization to another, but there are some common key elements.
The process usually starts with a demand or requirements – this could be for a physical part (inventory) or a service. A requisition is generated, which details the requirements (in some cases providing a requirements speciation) which actions the procurement department. A request for proposal (RFP) or request for quotation (RFQ) is then raised. Suppliers send their quotations in response to the RFQ, and a review is undertaken where the best offer (typically based on price, availability and quality) is given the purchase order." [Purchasing process. Wikipedia]
The accounting flowchart example "Purchasing flowchart" was created using the ConceptDraw PRO software extended with the Accounting Flowcharts solution from the Finance and Accounting area of ConceptDraw Solution Park.
Accounting flowchart
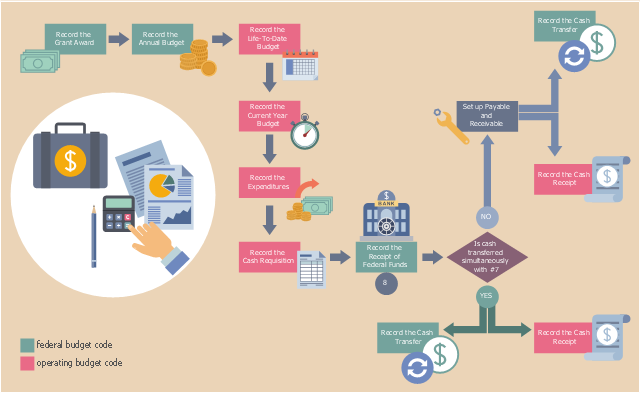
This example was designed on the base of the workflow diagram from the North Carolina Office of the State Controller website. [osc.nc.gov/ sigdocs/ sig_ docs/ documentation/ policies_ procedures/ flow.html]
"Grants are non-repayable funds or products disbursed by one party (grant makers), often a government department, corporation, foundation or trust, to a recipient, often (but not always) a nonprofit entity, educational institution, business or an individual. In order to receive a grant, some form of "Grant Writing" often referred to as either a proposal or an application is required. ...
Most grants are made to fund a specific project and require some level of compliance and reporting. The grant writing process involves an applicant submitting a proposal (or submission) to a potential funder, either on the applicant's own initiative or in response to a Request for Proposal from the funder. Other grants can be given to individuals, such as victims of natural disasters or individuals who seek to open a small business. Sometimes grant makers require grant seekers to have some form of tax-exempt status, be a registered nonprofit organization or a local government. ...
Project-related funding involving business, communities, and individuals is often arranged by application either in writing or online." [Grant (money). Wikipedia]
The workflow diagram example "Grant Accounting: business process flow" was created using ConceptDraw PRO software extended with the Business Process Workflow Diagrams solution from the Business Processes area of ConceptDraw Solution Park.
Workflow diagram
Physical Activity Plan

PERT Chart Software

ConceptDraw DIAGRAM is a powerful diagramming and vector drawing software for designing professional looking PERT Charts quick and easy.
Purchasing Flowchart - Purchase Order. Flowchart Examples

The flow chart example shows the steps of purchasing business process.
Entity Relationship Diagram Examples

Cross-Functional Flowchart Basics

All you need to know are a few basic steps and terms.
ConceptDraw Arrows10 Technology is a new age in drawing software. Use it for process flows and its new rapid draw feature enables to draw an impressive charts in a seconds.
Drawing Workflow Diagrams

Create Response Charts

Activity Network (PERT) Chart
 Chart *")
This diagram is constructed as part of the process in creating a schedule of corrective actions. The Activity Network Chart (PERT) shows the logical connections and consequence of tasks to be performed. It displays the time period for problem solving and the implementation of all activities through the critical path.
- Project plan timeline - Request for proposal ( RFP ) | Activity Network ...
- PERT chart - Request for proposal ( RFP )
- Project plan timeline - Request for proposal ( RFP )
- Project plan timeline - Request for proposal ( RFP ) | Gantt charts for ...
- Project plan timeline - Request for proposal ( RFP ) | Project Timeline ...
- Project timeline - Request for proposal plan | | Proposal Software ...
- Timeline diagram - Project schedule | Project plan timeline ...
- Project Timeline | Process Flow Chart | Program Evaluation and ...
- Rfp Process Flow Chart
- Project Timeline | How to Make a Timeline | Timeline Diagrams ...
- PERT chart - Template | Seven Management and Planning Tools ...
- Program Evaluation and Review Technique (PERT) with ...
- Activity Network Diagram Method | PERT Chart Software | Activity on ...
- Activity Network Diagram Method | Lucky Draw Software With ...
- Management | Ansoff's product / market matrix | Block diagram ...
- Activity on Node Network Diagramming Tool | Activity Network ...
- Activity Network Diagram Method | UML Activity Diagram. Design ...
- Flow chart Example. Warehouse Flowchart | Activity Network ...
- Business Process Diagrams | Purchasing flowchart | Quotation ...
- Product Proposal Documents Expanded | Product Proposal ...
- ERD | Entity Relationship Diagrams, ERD Software for Mac and Win
- Flowchart | Basic Flowchart Symbols and Meaning
- Flowchart | Flowchart Design - Symbols, Shapes, Stencils and Icons
- Flowchart | Flow Chart Symbols
- Electrical | Electrical Drawing - Wiring and Circuits Schematics
- Flowchart | Common Flowchart Symbols
- Flowchart | Common Flowchart Symbols