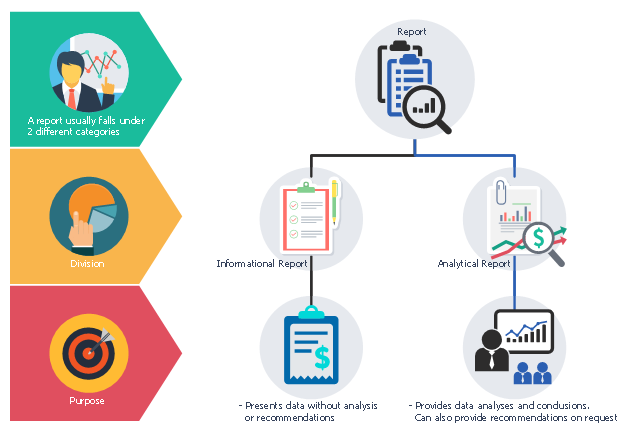
This business infographic sample shows the two types of report:
1. Informational report presents data without analysis or recommendations.
2. Analytical report provides data analyses and conclusions. Can also provide recommendations on request.
A report usually falls under 2 different categories: Division and Purpose.
This business infographic sample was designed on the base of the Wikimedia Commons file: Figure 12.1.png. [commons.wikimedia.org/ wiki/ File:Figure_ 12.1.png]
The business infographic example "Report" was designed using ConceptDraw PRO diagramming and vector drawing software extended with the Business and Finance solution from Illustration area of ConceptDraw Solution Park.
Infographic
HelpDesk
How to Get Images for Project Presentation on Macintosh

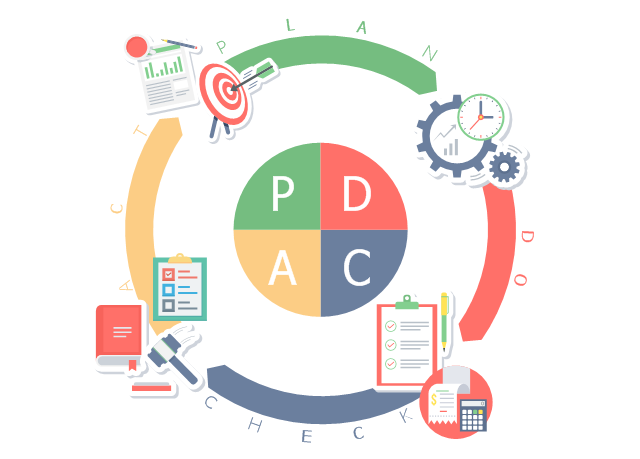
This business infographic sample shows the plan–do–check–act cycle. It was designed on the base of the Wikimedia Commons file: PDCA-Cycle.png.
[commons.wikimedia.org/ wiki/ File:PDCA-Cycle.png]
This file is licensed under the Creative Commons Attribution-Share Alike 3.0 Unported license. [creativecommons.org/ licenses/ by-sa/ 3.0/ deed.en]
"PDCA (plan–do–check–act or plan–do–check–adjust) is an iterative four-step management method used in business for the control and continual improvement of processes and products. It is also known as the Deming circle/ cycle/ wheel, Shewhart cycle, control circle/ cycle, or plan–do–study–act (PDSA)." [PDCA. Wikipedia]
The business infographic example "PDCA cycle" was designed using ConceptDraw PRO diagramming and vector drawing software extended with the Business and Finance solution from Illustration area of ConceptDraw Solution Park.
Infographic
 Pie Charts
Pie Charts are extensively used in statistics and business for explaining data and work results, in mass media for comparison (i.e. to visualize the percentage for the parts of one total), and in many other fields. The Pie Charts solution for ConceptDraw PRO v10 offers powerful drawing tools, varied templates, samples, and a library of vector stencils for simple construction and design of Pie Charts, Donut Chart, and Pie Graph Worksheets.
This healthcare economics infogram example was redesigned from the Wikimedia Commons file: Medicare spending per capita.png.
"Research by The Dartmouth Institute for Health Policy and Clinical Practice in the Dartmouth Atlas showed that in 2006, Medicare spending varied significantly by state. Other research quoted by the CEA Report indicated that up to 30% of Medicare costs could be saved if the middle- and high-cost states spent at the level of the lower-cost states.[1] Bear in mind that this is a Medicare comparison, so all the persons in the population analyzed are over 65.
References:
1. White House Council of Economic Advisors (CEA)-The Economic Case for Health Care Reform-June 2009-Page 19."
[commons.wikimedia.org/ wiki/ File:Medicare_ spending_ per_ capita.png]
The healthcare management thematic map sample "U.S. Medicare spending per capita" was created using the ConceptDraw PRO diagramming and vector drawing software extended with the Management Infographics solition from the area "Business Infographics" in ConceptDraw Solution Park.
Healthcare management infographics example

HelpDesk
How to Get Images for Project Presentation on Windows

HelpDesk
How to Use ConceptDraw PROJECT Micro - Reports


HelpDesk
How to Report on Project Milestones Using a Mind Map

- Health Report Png
- Timer Report Png
- How to Identify Project Milestones | How to Report on Project ...
- Performance Appraisal Report Vector Png
- Status Png
- Boss Employee Png
- Android Icon Report Png
- Michael Porter Png
- Business People Vector Png
- Photo gallery webpage (wireframe) | How to Report Task's ...
- Report Icon
- Tooth Png
- Food security assessment - Flowchart | Newsroom Png
- Investor Icon Png
- Stomach Png Vector
- Medicament Png
- Crutches Png
- Project Management Icon Vector Png
- Business Clipart Png
- Healthy Icon Png
- ERD | Entity Relationship Diagrams, ERD Software for Mac and Win
- Flowchart | Basic Flowchart Symbols and Meaning
- Flowchart | Flowchart Design - Symbols, Shapes, Stencils and Icons
- Flowchart | Flow Chart Symbols
- Electrical | Electrical Drawing - Wiring and Circuits Schematics
- Flowchart | Common Flowchart Symbols
- Flowchart | Common Flowchart Symbols