Circle Spoke Diagram Template

The vector stencils library "Circular diagrams" contains 42 templates of circular diagrams: circular arrow diagram, circular motion diagram, arrow ring chart, doughnut chart (donut chart), circle pie chart, diamond pie chart, circle diagram, pie chart, ring chart, loop diagram, block loop diagram, arrow loop circle, crystal diagram, triangular diagram, diamond diagram, pentagon diagram, hexagon diagram, heptagon diagram, cycle diagram (cycle chart), stacked Venn diagram (onion diagram), arrow circle diagram.
Use these shapes to illustrate your marketing and sales documents, presentations, webpages and infographics in the ConceptDraw PRO diagramming and vector drawing software extended with the Target and Circular Diagrams solution from the Marketing area of ConceptDraw Solution Park.
www.conceptdraw.com/ solution-park/ marketing-target-and-circular-diagrams
Circular arrow diagram 1
Circular arrow diagram 2
Arrow ring chart
Doughnut chart

Diamond pie chart

Pie chart

Circle diagram

Circle pie chart 2

Circle pie chart 1

Ring chart 1 - 3 elements

Ring chart 1 - 4 elements

Ring chart 1 - 5 elements

Ring chart 1 - 6 elements

Ring chart 1 - 7 elements

Ring chart 2 - 3 elements

Ring chart 2 - 4 elements

Ring chart 2 - 5 elements

Ring chart 2 - 6 elements

Ring chart 2 - 7 elements

Crystal diagram - 3 elements

Crystal diagram - 4 elements

Crystal diagram - 5 elements

Crystal diagram - 6 elements

Crystal diagram - 7 elements

Stacked Venn diagram - 4

Stacked Venn diagram - 5

Stacked Venn diagram - 6

Stacked Venn diagram - 7

Basic loop diagram

Block loop diagram

Arrow loop circle
Arrow loop - 3 circles
Arrow loop - 4 circles
Arrow loop - 5 circles
Arrow loop - 6 circles
Arrow loop - 7 circles
Arrow circle diagram - 3
Arrow circle diagram - 4
Stacked Venn diagram - 3

Arrow circle diagram - 5
Arrow circle diagram - 6
Arrow circle diagram - 7
Circle Diagrams

This circle pie chart sample was created on the base of the figure illustrating the article "Impacts of Parking Strategies" from the Chicago Metropolitan Agency for Planning website. "Todd Litman's "Cycle of Automobile Dependency" shows how auto-centric land use planning and excessive parking supply have created this situation. Parking management strategies can be used to break this cycle, by changing development patterns and improving travel options (2006)." [cmap.illinois.gov/ about/ 2040/ supporting-materials/ process-archive/ strategy-papers/ parking/ impacts-of-parking-strategies]
The circle pie chart example "Cycle of automobile dependency" was created using the ConceptDraw PRO diagramming and vector drawing software extended with the Target and Circular Diagrams solution from the Marketing area of ConceptDraw Solution Park.
www.conceptdraw.com/ solution-park/ marketing-target-and-circular-diagrams
Circle pie chart

UML Diagram for Mac

Pie Chart Examples and Templates

Pie chart examples and templates created using ConceptDraw PRO software helps you get closer with pie charts and find pie chart examples suite your needs.
This wheel diagram sample was created on the base of figure illustrating the webpage "Chapter 3: Current State of the Ecosystem" of the website of the National Broadband Plan of US Federal Communications Comission (FCC). "The broadband ecosystem includes applications and content: e-mail, search, news, maps, sales and marketing applications used by businesses, user-generated video and hundreds of thousands of more specialized uses. Ultimately, the value of broadband is realized when it delivers useful applications and content to end-users.
Applications run on devices that attach to the network and allow users to communicate: computers, smartphones, set-top boxes, e-book readers, sensors, private branch exchanges (PBX), local area network routers, modems and an ever-growing list of other devices. New devices mean new opportunities for applications and content.
Finally, broadband networks can take multiple forms: wired or wireless, fixed or mobile, terrestrial or satellite. Different types of networks have different capabilities, benefits and costs.
The value of being connected to the network increases as more people and businesses choose to adopt broadband and use applications and devices that the network supports. Several factors contribute to their decisions. These include whether they can afford a connection, whether they are comfortable with digital technology and whether they believe broadband is useful.
Networks, devices and applications drive each other in a virtuous cycle. If networks are fast, reliable and widely available, companies produce more powerful, more capable devices to connect to those networks. These devices, in turn, encourage innovators and entrepreneurs to develop exciting applications and content. These new applications draw interest among end-users, bring new users online and increase use among those who already subscribe to broadband services. This growth in the broadband ecosystem reinforces the cycle, encouraging service providers to boost the speed, functionality and reach of their networks."
[broadband.gov/ plan/ 3-current-state-of-the-ecosystem/ ]
The circle pie chart example "Forces shaping the broadband ecosystem in the US" was created using the ConceptDraw PRO diagramming and vector drawing software extended with the Target and Circular Diagrams solution from the Marketing area of ConceptDraw Solution Park.
www.conceptdraw.com/ solution-park/ marketing-target-and-circular-diagrams
Wheel diagram

Social Media Flowchart Symbols

 Pie Charts
Pie Charts are extensively used in statistics and business for explaining data and work results, in mass media for comparison (i.e. to visualize the percentage for the parts of one total), and in many other fields. The Pie Charts solution for ConceptDraw PRO v10 offers powerful drawing tools, varied templates, samples, and a library of vector stencils for simple construction and design of Pie Charts, Donut Chart, and Pie Graph Worksheets.
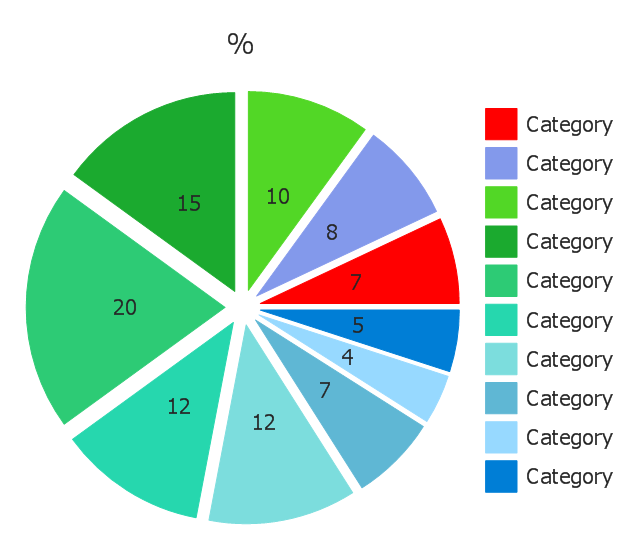
Use this exploded pie chart template in the ConceptDraw PRO diagramming and vector drawing software to emphasize a particular piece of your pie chart.
"A chart with one or more sectors separated from the rest of the disk is known as an exploded pie chart. This effect is used to either highlight a sector, or to highlight smaller segments of the chart with small proportions." [Pie chart. Wikipedia]
The template "Exploded pie chart (percentage)" is included in the Pie Charts solution of the Graphs and Charts area in ConceptDraw Solution Park.
Circle chart
---template.png--diagram-flowchart-example.png)
Use this exploded pie chart template in the ConceptDraw PRO diagramming and vector drawing software to visualize data as percentages of the whole, especially when small values are represented by narrow slices.
"A chart with one or more sectors separated from the rest of the disk is known as an exploded pie chart. This effect is used to either highlight a sector, or to highlight smaller segments of the chart with small proportions." [Pie chart. Wikipedia]
The template "Exploded pie chart" is included in the Pie Charts solution of the Graphs and Charts area in ConceptDraw Solution Park.
Circle chart
How to Create a Pie Chart

Use this circle chart template to design your sector diagrams.
"A chart is a graphical representation of data, in which the data is represented by symbols, such as ... slices in a pie chart. ... Charts are often used to ease understanding ... the relationships between parts of the data. ... For example, data that presents percentages in different groups (such as "satisfied, not satisfied, unsure") are often displayed in a pie chart ... A pie chart shows percentage values as a slice of a pie." [Chart. Wikipedia]
The template "Sector diagram" for the ConceptDraw PRO diagramming and vector drawing software is included in the Pie Charts solution of the Graphs and Charts area in ConceptDraw Solution Park.
Circle chart

Pie Chart Software

ConceptDraw PRO software with Pie Charts solution helps to create pie and donut charts for effective displaying proportions in statistics, business and mass media for composition comparison, i.e. for visualization of part percentage inside one total.
Best Diagramming


- Circles Venn Diagram
- Interactive Venn Diagram | Venn Diagram Examples for Problem ...
- Pie Chart Examples and Templates | Arrow circle chart - Template ...
- Sector diagram - Template | Circle Spoke Diagram Template | Pie ...
- 3 Circle Venn Diagram. Venn Diagram Example | Venn Diagrams ...
- Relationship Circle Diagram
- Circle Diagrams | What Is a Circle Spoke Diagram | Pie Chart ...
- Two Circle Venn Diagram
- 3 Circle Venn. Venn Diagram Example | What Is a Circle Spoke ...
- Circle Spoke Diagram Template | Best Diagramming | Pie Chart ...
- Venn Diagram In 3 Circles Solution
- Circle Spoke Diagram Template | Pie Chart Examples and ...
- Circles Venn Diagram | Venn Diagram Template | Venn Diagram | 4 ...
- 2 Circle Venn Diagram. Venn Diagram Example | Venn Diagram | 3 ...
- Basic Flowchart Symbols and Meaning | Circle Spoke Diagram ...
- Cycle of automobile dependency - Circle pie chart | Content ...
- Circle Spoke Diagram Template | Pie Chart Word Template. Pie ...
- 4-Set Venn diagram - Template | Circles Venn Diagram | Circular ...
- Arrow circle chart - Template | How to Draw a Circular Arrows ...
- Venn Diagram Examples for Problem Solving . Quantum Information ...
- ERD | Entity Relationship Diagrams, ERD Software for Mac and Win
- Flowchart | Basic Flowchart Symbols and Meaning
- Flowchart | Flowchart Design - Symbols, Shapes, Stencils and Icons
- Flowchart | Flow Chart Symbols
- Electrical | Electrical Drawing - Wiring and Circuits Schematics
- Flowchart | Common Flowchart Symbols
- Flowchart | Common Flowchart Symbols