Restaurant Floor Plan Software
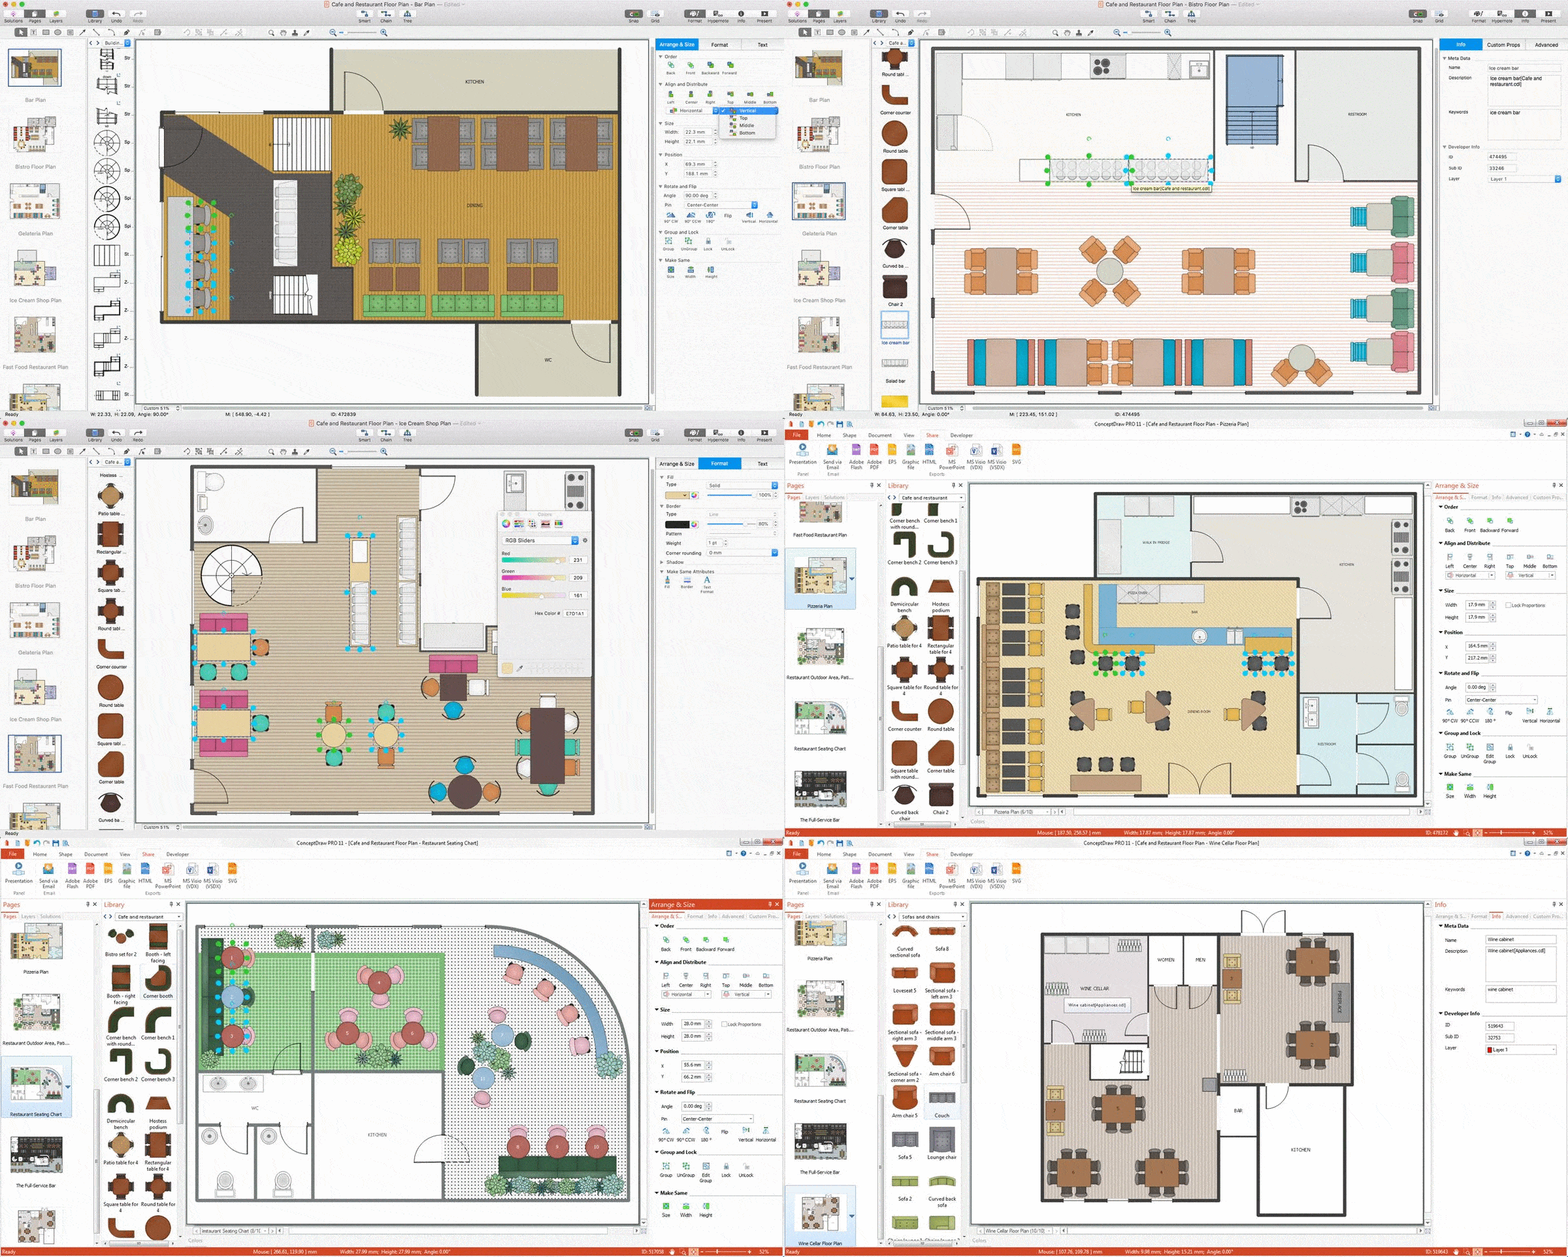
The restaurant is a special place for relax and recreation. Its design and atmosphere must be unique. Planning, design, music, kitchen, service create an unforgettable atmosphere of comfort, harmony, convenience.You can create quick custom designs of: Restaurant layouts, Restaurant Floor plans,
Restaurant Design with our Restaurant Floor Plans Software.
Cafe Interior Design
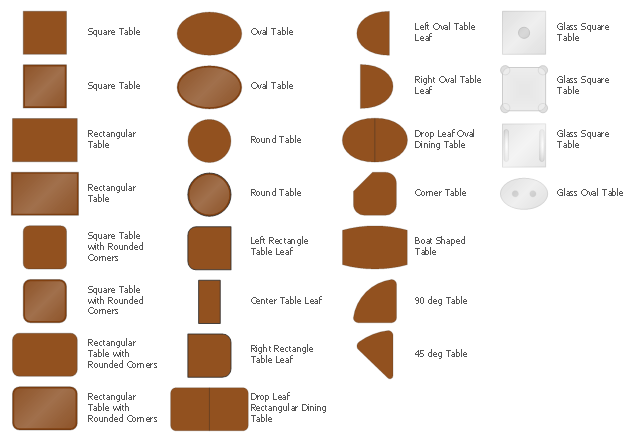
Successful Cafe Interior Design is so much broad definition, it includes a lot of things beginning from the choice of furniture and its placement, and finishing by the elements of design and interior, and by many other little details. ConceptDraw DIAGRAM offers the Cafe and Restaurant Floor Plan Solution from the Building Plans area allowing architects and designers develop and represent the Cafe Interior Design of any detailing.The design elements library Tables contains 27 symbols of tables.
Use the vector stencils library Tables to develop house floor plans, home designs, kitchen and dining room design and furniture layout of cafe or restaurant.
"A table is a form of furniture with a flat horizontal upper surface used to support objects of interest, for storage, show, and/ or manipulation. The surface must be held stable; for reasons of simplicity, this is usually done by support from below by either a column, a "base", or at least three columnar "stands". In special situations, table surfaces may be supported from a nearby wall, or suspended from above.
Common design elements include:
top surfaces of various shapes, including rectangular, rounded, or semi-circular;
legs arranged in two or more similar pairs;
several geometries of folding table that can be collapsed into a smaller volume;
heights ranging up and down from the most common 18–30 inches (46–76 cm) range, often reflecting the height of chairs or bar stools used as seating for people making use of a table, as for eating or performing various manipulations of objects resting on a table;
presence or absence of drawers;
expansion of the surface by insertion of leaves or locking hinged drop leaf sections into horizontal position.
Desks are tables specifically intended for information-manipulation tasks, including writing and use of interactive electronics.
Tables of various shapes, heights, and sizes are designed for specific uses:
Dining room tables are designed to be used for formal dining.
Bedside tables, nightstands, or night tables are small tables used in a bedroom. They are often used for convenient placement of a small lamp, alarm clock, glasses, or other personal items.
Gateleg tables have one or two hinged leaves supported by hinged legs.
Coffee tables are low tables designed for use in a living room, in front of a sofa, for convenient placement of drinks, books, or other personal items.
Refectory tables are long tables designed to seat many people for meals.
Drafting tables usually have a top that can be tilted for making a large or technical drawing. They may also have a ruler or similar element integrated.
Workbenches are sturdy tables, often elevated for use with a high stool or while standing, which are used for assembly, repairs, or other precision handwork.
Nested tables are a set of small tables of graduated size that can be stacked together, each fitting within the one immediately larger. They are for occasional use (such as a tea party), hence the stackable design." [Table (furniture). Wikipedia]
The shapes library Tables is provided by the Floor Plans solution from the Building Plans area of ConceptDraw Solution Park.
HelpDesk
How to Draw a Divided Bar Chart
A divided bar graph is a rectangle divided into smaller rectangles along its length in proportion to the data. Segments in a divided bar represent a set of quantities according to the different proportion of the total amount. A divided bar diagram is created using rectangular bars to depict proportionally the size of each category. The bars in a divided bar graph can be vertical or horizontal. The size of the each rectangle displays the part that each category represents. The value of the exact size of the whole must be known, because the each section of the bar displays a piece of that value. A divided bar diagram is rather similar to a sector diagram in that the bar shows the entire data amount and the bar is divided into several parts to represent the proportional size of each category. ConceptDraw DIAGRAM in conjunction with Divided Bar Diagrams solution provides tools to create stylish divided bar charts for your presentations.Building Drawing. Design Element Site Plan
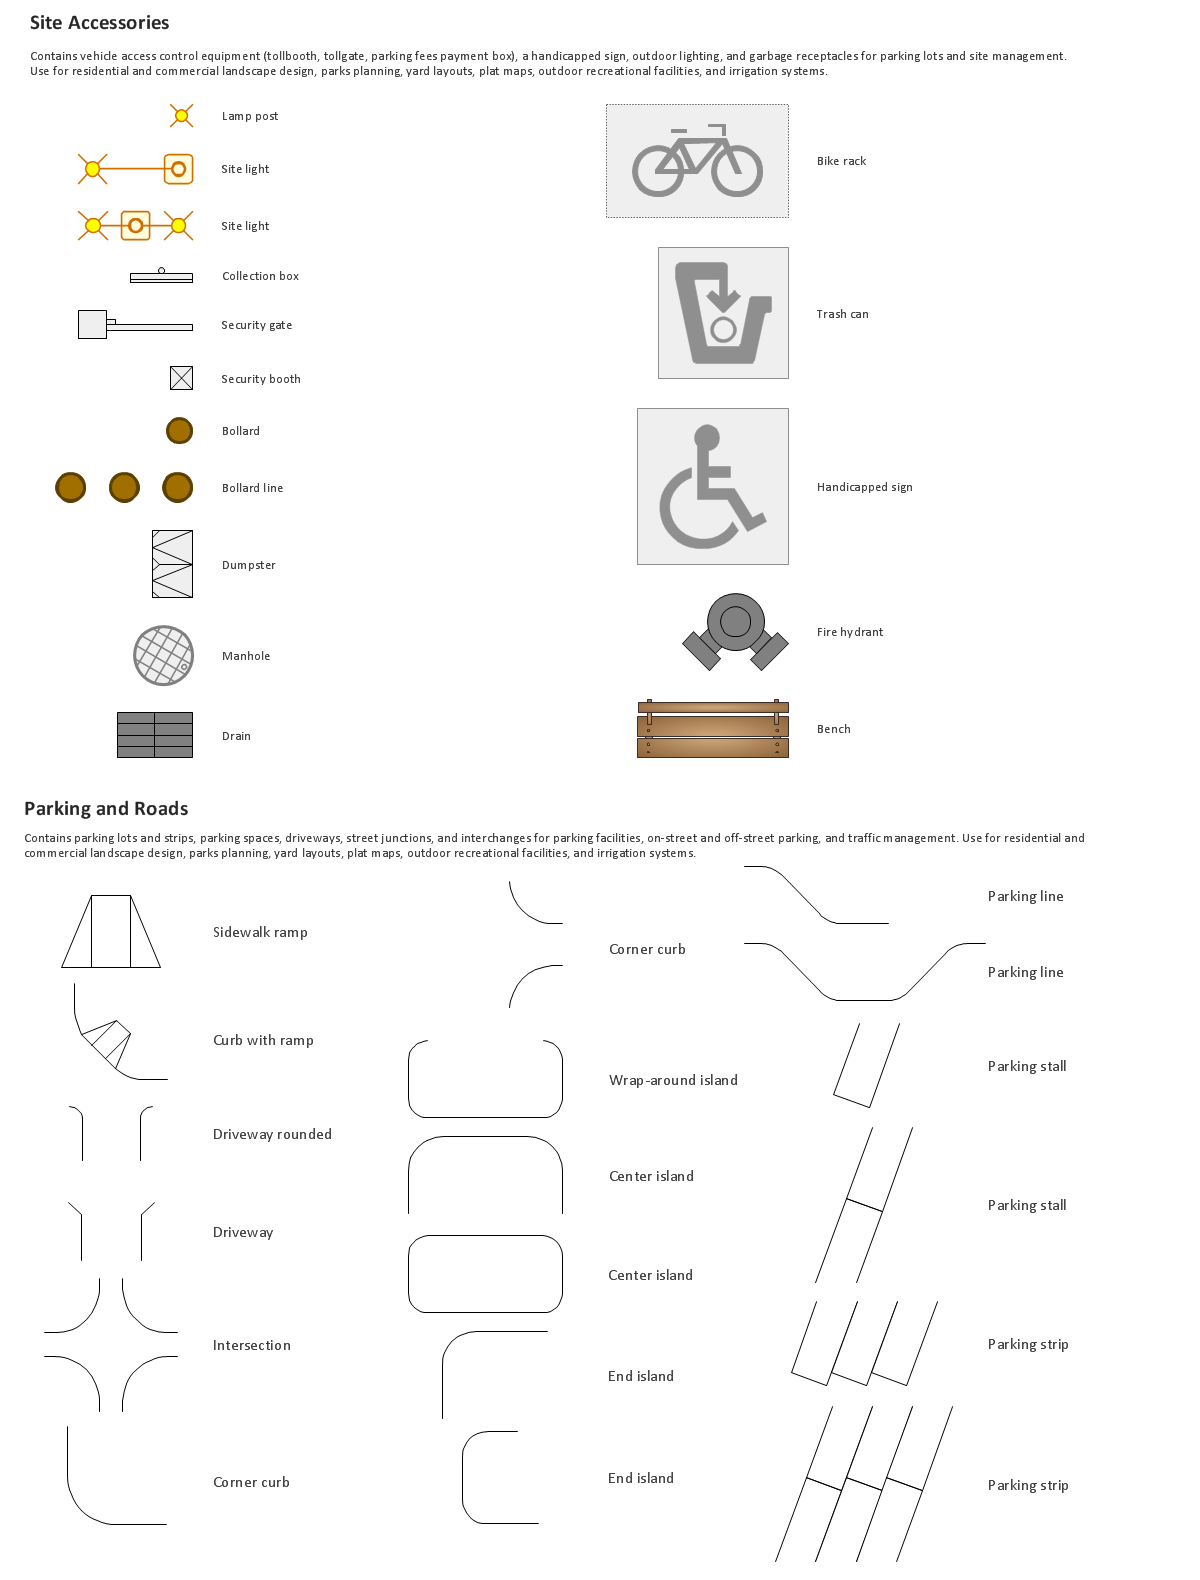
Site Plan is a graphic representation of the arrangement of buildings, parking, drives, landscaping and any other structure that is part of a development project.Use Site Plan symbols to draw your own residential and commercial landscape design, parks planning, yard layouts, plat maps, outdoor recreational facilities, and irrigation systems.

HelpDesk
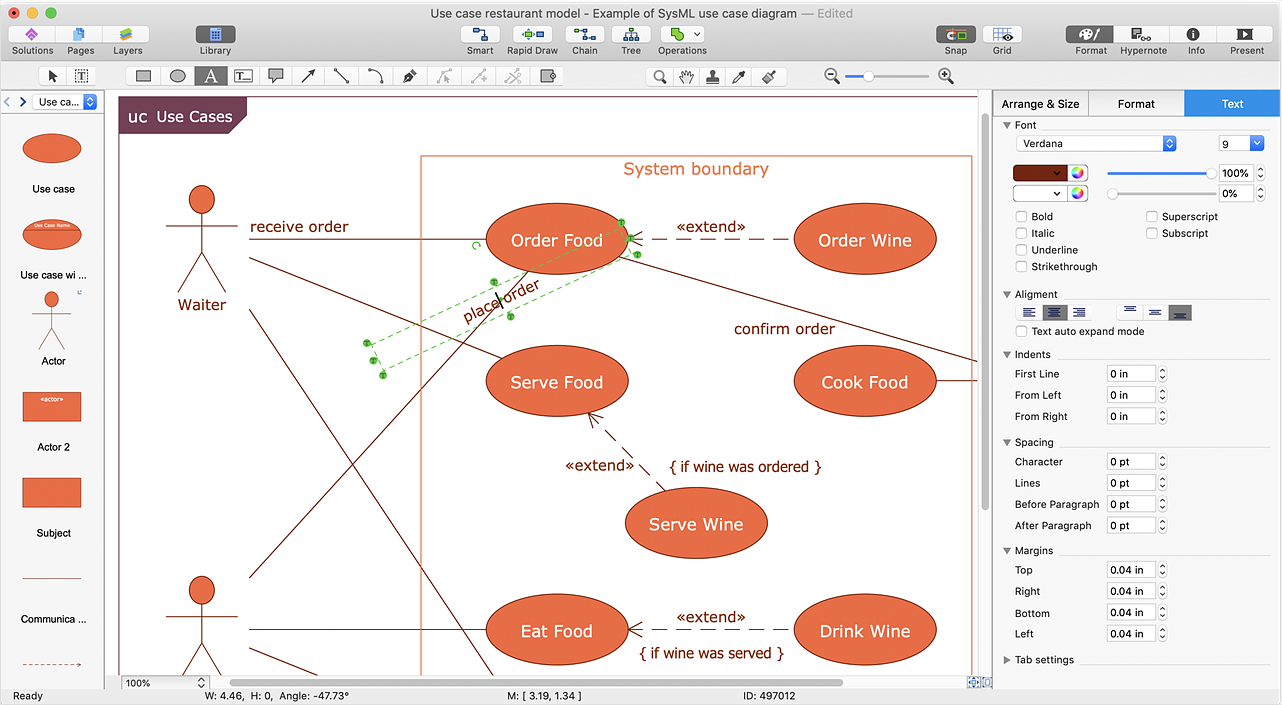
How to Add and Edit Connector Text
ConceptDraw DIAGRAM gives you some tools for connecting shapes: Direct Connectors, Smart, Arc, Bezier, Curve and Round Connectors. Direct Connectors are direct lines from the point to the point. Smart, Arc, Bezier, Curve and Round Connectors are almost the same as Direct Connectors. However, they automatically move around other objects. You can use Chain, or Tree connection mode for connection of multiple objects with any type of connectors. ConceptDraw DIAGRAM allows you to add and move text on a connector the same way that you add and move text on other any object.HelpDesk
How to Resize Objects Disproportionately
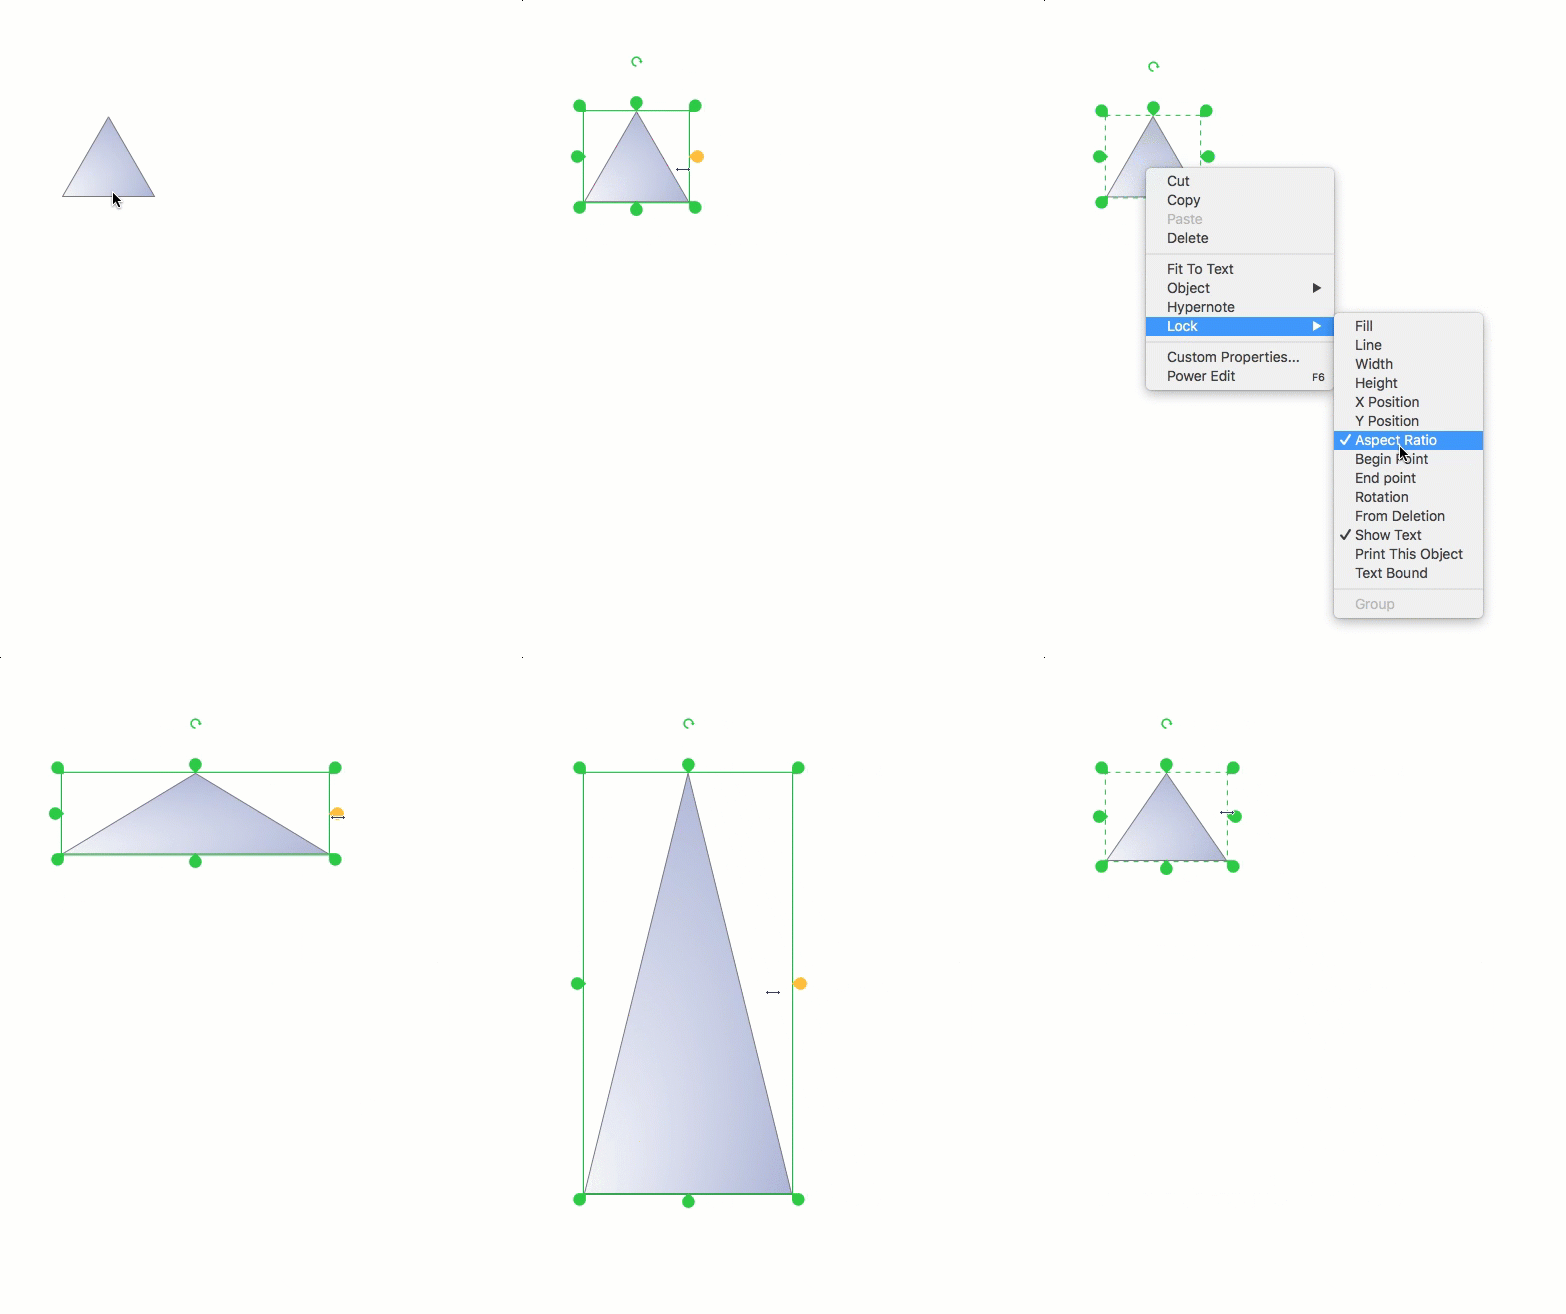
ConceptDraw DIAGRAM gives you the possibility to freely move, resize, and rotate objects. You can make them proportionally larger or smaller, as well as resize objects to make them longer or shorter in just a selected dimension.HelpDesk
How to Create Flowchart Using Standard Flowchart Symbols
Flowcharts are used to display an algorithm for consistent execution of certain steps. A flowchart is probably the easiest way to make a graphical representation of any process. Flowcharts use the set of standard geometric symbols and arrows to define relationships. ConceptDraw DIAGRAM allows you to create professional flowchart quickly and easily. The ability to create flowcharts is contained in the Flowcharts solution. The solution provides a set of special tools for creating flowcharts.HelpDesk
How to Draw a Histogram
Histogram is a diagram used to visualize data through bars of variable heights. Making histogram can be helpful if you need to show data covering various periods (hours, days, weeks, etc). When the vertical column of the histogram refer to frequency it shows how many times any event happens. It is a Frequency histogram. A bar chart diagram is similar to a histogram, but in contrast to a bar chart a histogram represents the number how many times there have been certain data values. You can use a histogram to depict continual data flow such as temperature, time, etc. You can effortlessly draw histograms using the Histograms solution for CnceptDraw DIAGRAM. Making a histogram can by very useful to represent various statistical data.HelpDesk
How to Create a Cloud Computing Diagram
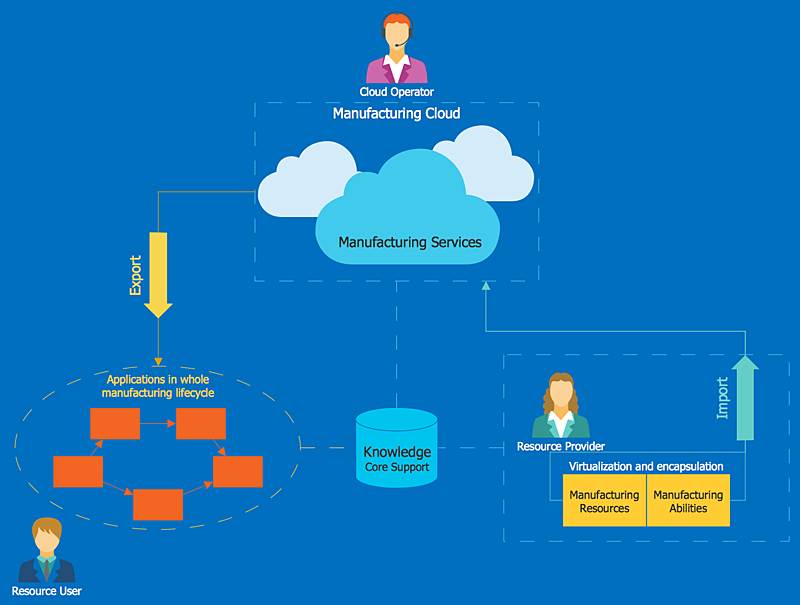
Cloud computing is a model of remote access to shared computing resources that are physically distributed in many remote devices. Cloud Computing is a technology that allows using the Internet to place computing resources and the provision of such services to customers. Using cloud computing means assigning responsibilities on applications and data storage service among special systems, which have a very high level of reliability and unlimited resources. The result is reducing the cost of service and providing users with ready-to-use service.ConceptDraw's Cloud Computing Diagrams solution allows you to visualize cloud computing models of any configuration and complexity.
HelpDesk
How to Make Soccer Position Diagram
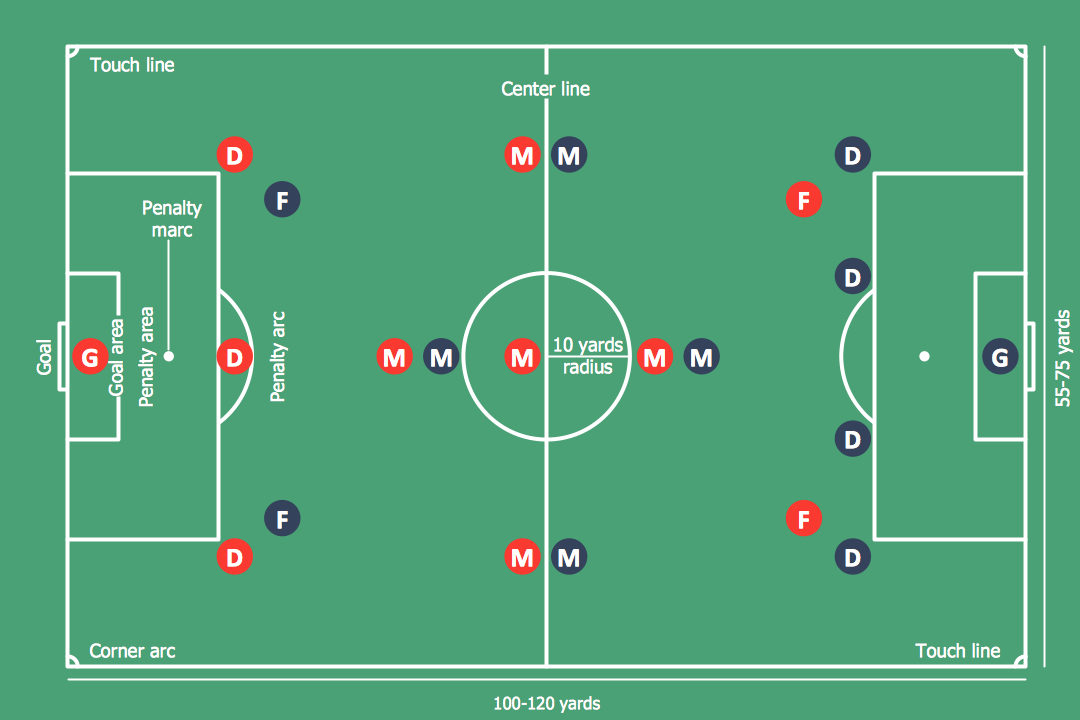
The soccer field has the form of a large rectangle, covered with grass. Dimensions of soccer fields may vary slightly, depending on the level of the game, but all fields have some common characteristics. Soccer players may take different positions. Each soccer position has its own name and implies certain player functions. Every soccer position has a very specific name and task: Goalkeeper, Defenders, Midfielders and Forwards. During preparation for the game, coach met a challenge: how to explain each player's position and his role in the game. The difficulty is the fact that in the course of the game players will often move on the field and do not stay in one place. Football field diagram with dimensions and marking, and positions - it is an important tool for the coach. ConceptDraw DIAGRAM helps both coach and players to understand exactly their roles during the particular game. The ability to create Soccer diagrams is contained in the ConceptDraw Soccer solution. The solution provides
 Histograms
How to make a Histogram? Making a Histogram is an incredibly easy process when it is done with ConceptDraw DIAGRAM. The Histograms Solution enhances ConceptDraw DIAGRAM functionality with extensive drawing tools, numerous samples, and examples; also a quick-start template and library of ready vector stencils for visualization the data and professional drawing Histograms.
 Divided Bar Diagrams
The Divided Bar Diagrams Solution extends the capabilities of ConceptDraw DIAGRAM with templates, samples, and a library of vector stencils for drawing high impact and professional Divided Bar Diagrams and Graphs, Bar Diagram Math, and Stacked Graph.
- Tables - Vector stencils library | Restaurant Floor Plan Software ...
- Cafe and Restaurant Floor Plan | Cafe Floor Plan Design Software ...
- Cafe and Restaurant Floor Plan
- Design elements - Tables | Rectangle Table Leaf
- Symbol for Pool Table for Floor Plans | Table Seating Chart ...
- Rectangular Table
- Png Rectangle Designs
- Round Table
- How To Create Restaurant Floor Plan in Minutes | Interior Design ...
- Tables - Vector stencils library
- Design elements - Parking and roads | Site Layout For Rectangle ...
- Design elements - Tables | Tables - Vector stencils library | Design ...
- Seating Plans | Building Drawing Software for Design Seating Plan ...
- Interior Design Registers, Drills and Diffusers - Design Elements ...
- How To Create Restaurant Floor Plan in Minutes | Cafe and ...
- Design elements - Windows 8 round icons | How To Create ...
- How To Create Restaurant Floor Plan in Minutes | Building Drawing ...
- Basic Diagramming | Design elements - Solid geometry | Solid ...
- Cafe and Restaurant Floor Plan | How To Create Restaurant Floor ...
- Design elements - Sofas and chairs | Design elements - Kitchen and ...
- ERD | Entity Relationship Diagrams, ERD Software for Mac and Win
- Flowchart | Basic Flowchart Symbols and Meaning
- Flowchart | Flowchart Design - Symbols, Shapes, Stencils and Icons
- Flowchart | Flow Chart Symbols
- Electrical | Electrical Drawing - Wiring and Circuits Schematics
- Flowchart | Common Flowchart Symbols
- Flowchart | Common Flowchart Symbols
