Hiring Process

ConceptDraw DIAGRAM diagramming and vector drawing software aspires to help its users in the hiring process and offers a powerful HR Flowcharts Solution from the Management Area of ConceptDraw Solution Park.
HelpDesk
How to Create a HR Process Flowchart
Recruitment

The recruitment process often requires design and use of various HR flowcharts, diagrams, attractive illustrations. Never before their creation wasn’t so easy as now with HR Flowcharts Solution from the Management Area of ConceptDraw Solution Park.
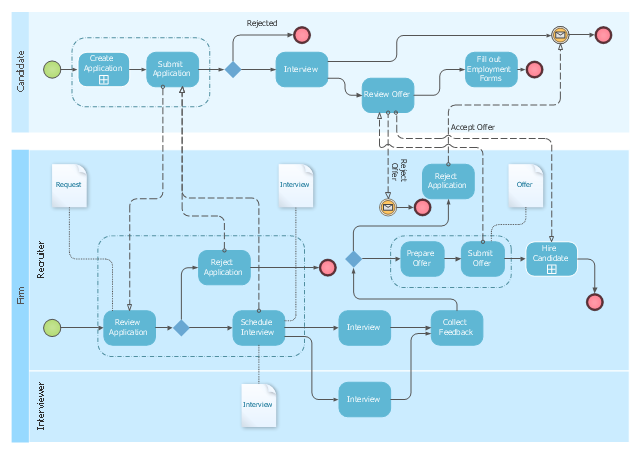
This BPMN diagram sample shows the recruitment (hiring) process workflow.
"Recruitment refers to the process of attracting, screening, selecting, and onboarding a qualified person for a job. At the strategic level it may involve the development of an employer brand which includes an "employee offering".
The stages of the recruitment process include: job analysis and developing some person specification; the sourcing of candidates by networking, advertising, and other search methods; matching candidates to job requirements and screening individuals using testing (skills or personality assessment); assessment of candidates' motivations and their fit with organizational requirements by interviewing and other assessment techniques. The recruitment process also includes the making and finalizing of job offers and the induction and onboarding of new employees.
Depending on the size and culture of the organization, recruitment may be undertaken in-house by managers, human resource generalists and/ or recruitment specialists. Alternatively, parts of the process may be undertaken by either public-sector employment agencies, commercial recruitment agencies, or specialist search consultancies." [Recruitment. Wikipedia]
The BPMN (Business Process Model and Notation) diagram example "Hiring process BPMN 1.2 diagram" was created using the ConceptDraw PRO diagramming and vector drawing software extended with the Business Process Diagram solution from the Business Processes area of ConceptDraw Solution Park.
Employee recruitment workflow
Hiring Process Steps
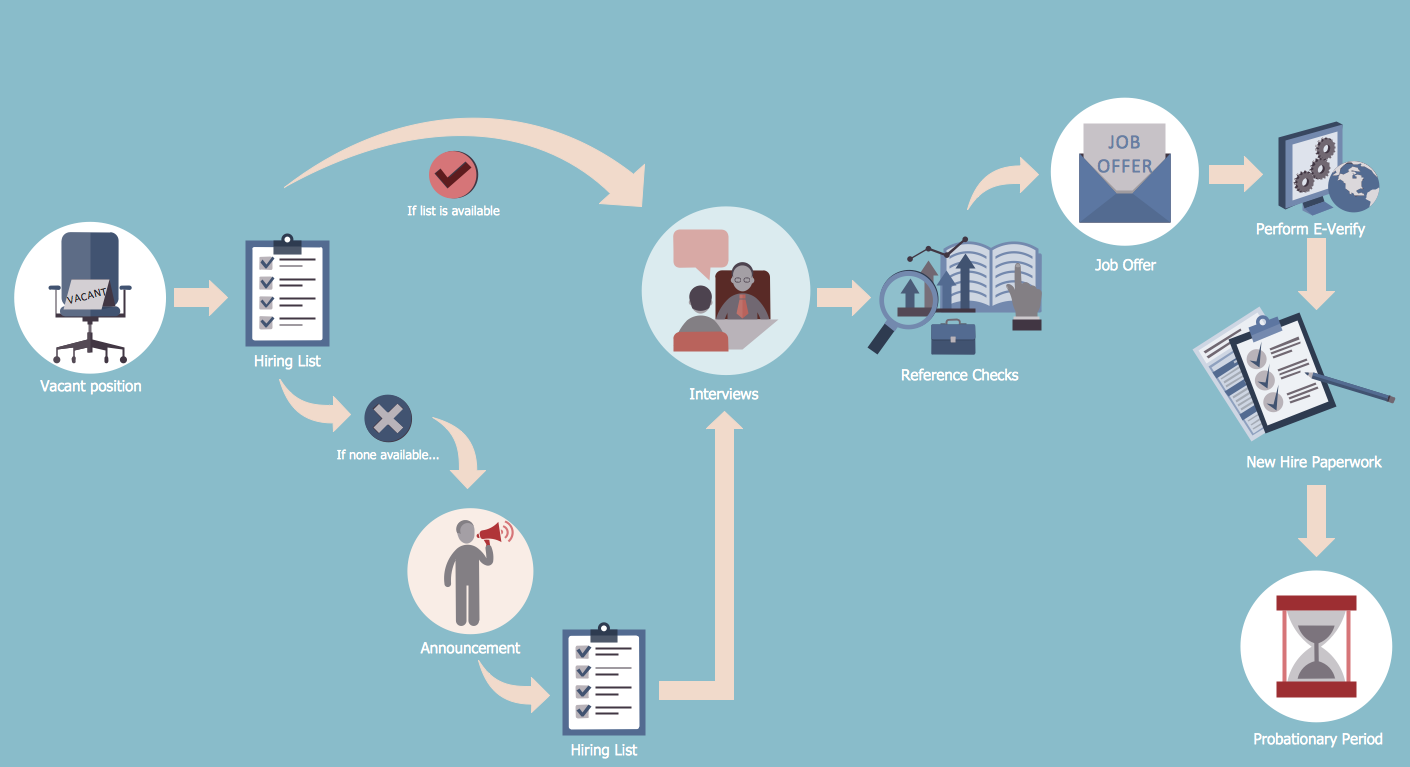
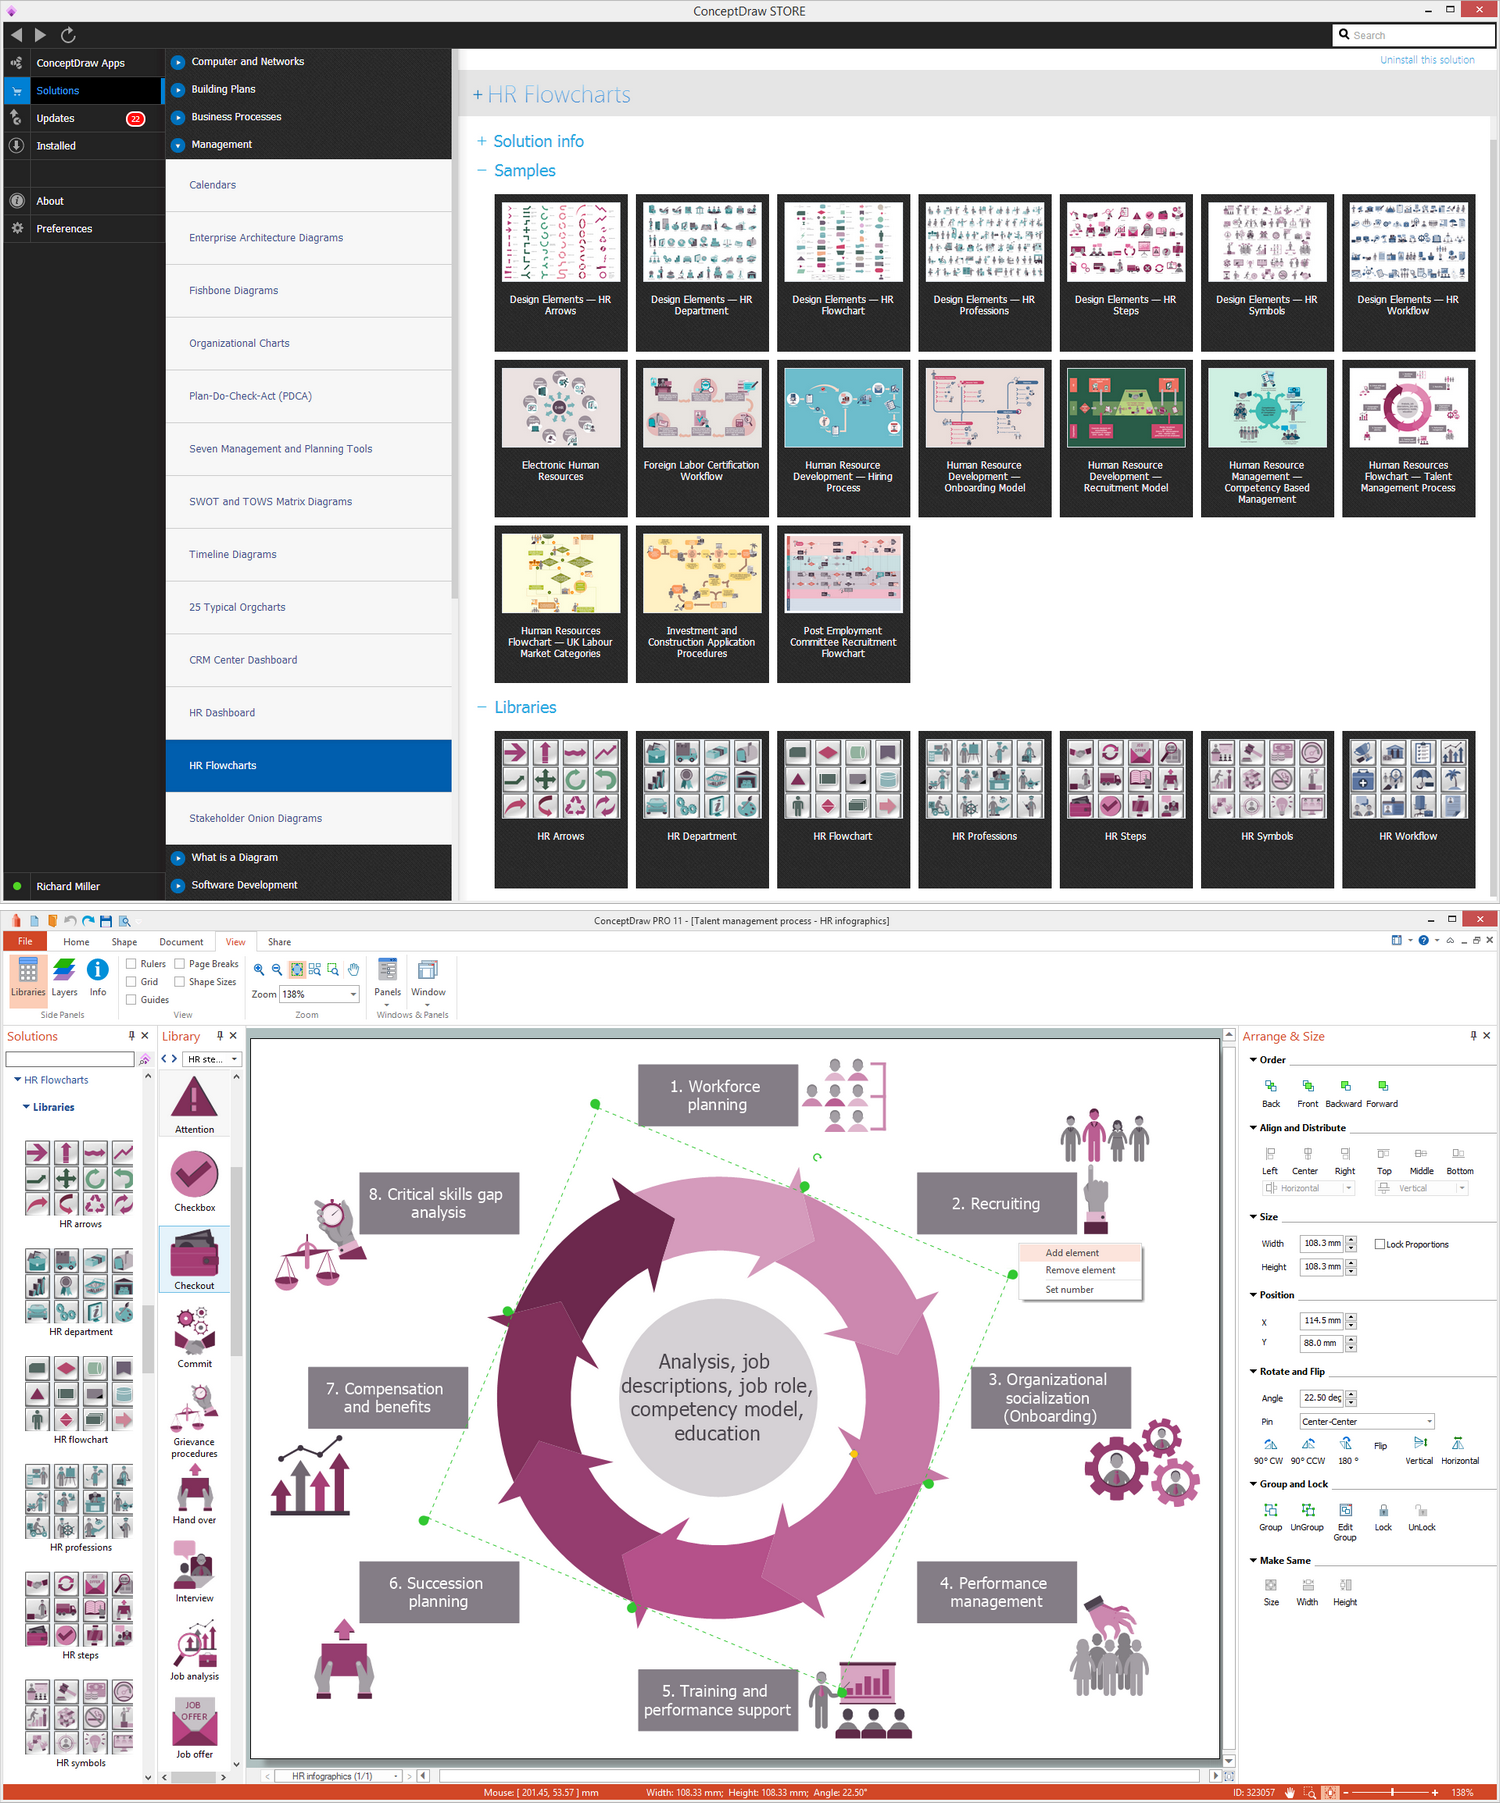
ConceptDraw DIAGRAM is a powerful diagramming and vector drawing software. Now, thanks to the new HR Flowcharts Solution from the Management Area of ConceptDraw Solution Park, it become also ideal for designing HR Flowcharts and visually displaying the hiring process steps.
The vector stencils library "Meter indicators" contains 29 Live Objects: speedometer gauge, dial, bullet graph, slider and level meter visual indicators.
The Live Objects designed to display actual measures of performance metrics and KPIs from external data source files.
Some of them also display comparative measures, and colored zones of qualitative ranges with legend.
Use it to draw business performance dashboards using the ConceptDraw PRO diagramming and vector drawing software .
"Digital dashboards may be laid out to track the flows inherent in the business processes that they monitor. Graphically, users may see the high-level processes and then drill down into low level data. This level of detail is often buried deep within the corporate enterprise and otherwise unavailable to the senior executives. ...
Specialized dashboards may track all corporate functions. Examples include human resources, recruiting, sales, operations, security, information technology, project management, customer relationship management and many more departmental dashboards. ...
Like a car's dashboard (or control panel), a software dashboard provides decision makers with the input necessary to "drive" the business. Thus, a graphical user interface may be designed to display summaries, graphics (e.g., bar charts, pie charts, bullet graphs, "sparklines," etc.), and gauges (with colors similar to traffic lights) in a portal-like framework to highlight important information. ...
Digital dashboards allow managers to monitor the contribution of the various departments in their organization. To gauge exactly how well an organization is performing overall, digital dashboards allow you to capture and report specific data points from each department within the organization, thus providing a "snapshot" of performance." [Dashboard (management information systems). Wikipedia]
The example "Design elements - Meter indicators" is included in the Meter Dashboard solution from the area "What is a Dashboard" of ConceptDraw Solution Park.
Visual indicators

Human Resource Management

Employment Form Software
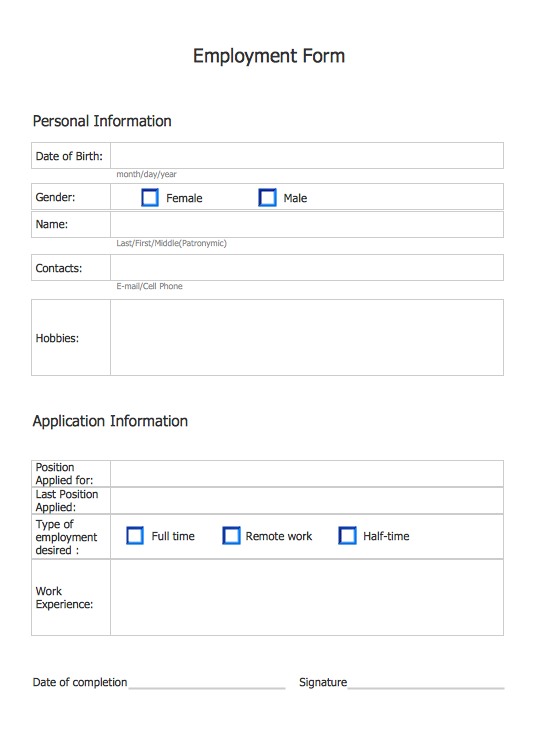
It's very easy and convenient to use the employment form templates from the Basic Diagramming Solution for ConceptDraw DIAGRAM as the base for creating your own employment forms.
This financila dashboard example was drawn on the base of the Enterprise dashboard from the Mecklenburg County Government website.
[charmeck.org/ mecklenburg/ county/ CountyManagersOffice/ OMB/ dashboards/ Pages/ Enterprise.aspx]
"In management information systems, a dashboard is "an easy to read, often single page, real-time user interface, showing a graphical presentation of the current status (snapshot) and historical trends of an organization’s key performance indicators to enable instantaneous and informed decisions to be made at a glance."
For example, a manufacturing dashboard may show key performance indicators related to productivity such as number of parts manufactured, or number of failed quality inspections per hour. Similarly, a human resources dashboard may show KPIs related to staff recruitment, retention and composition, for example number of open positions, or average days or cost per recruitment.
Types of dashboards.
Dashboard of Sustainability screen shot illustrating example dashboard layout.
Digital dashboards may be laid out to track the flows inherent in the business processes that they monitor. Graphically, users may see the high-level processes and then drill down into low level data. This level of detail is often buried deep within the corporate enterprise and otherwise unavailable to the senior executives.
Three main types of digital dashboard dominate the market today: stand alone software applications, web-browser based applications, and desktop applications also known as desktop widgets. The last are driven by a widget engine.
Specialized dashboards may track all corporate functions. Examples include human resources, recruiting, sales, operations, security, information technology, project management, customer relationship management and many more departmental dashboards.
Digital dashboard projects involve business units as the driver and the information technology department as the enabler. The success of digital dashboard projects often depends on the metrics that were chosen for monitoring. Key performance indicators, balanced scorecards, and sales performance figures are some of the content appropriate on business dashboards." [Dashboard (management information systems). Wikipedia]
The example "Enterprise dashboard" was created using the ConceptDraw PRO diagramming and vector drawing software extended with the Composition Dashboard solution from the area "What is a Dashboard" of ConceptDraw Solution Park.
Financial dashboard

Human Resources
- Employment Form Software | Post Employment Committee ...
- Recruitment | Post Employment Committee recruitment flowchart ...
- HR steps - Vector stencils library | HR steps - Vector stencils library ...
- Hiring process BPMN 1.2 diagram | Recruitment | HR Management ...
- Human Resources Hiring Flowchart Example
- Hiring Process | Recruitment | Human Resource Development | Hr ...
- Recruitment | Hiring Process | HR Management Software ...
- HR Flowcharts | Recruitment | HR Flowchart Symbols | Flowchart For ...
- Hiring process BPMN 1.2 diagram | Business diagrams & Org Charts ...
- Hiring Process | Business Process Mapping — How to Map a Work ...
- ERD | Entity Relationship Diagrams, ERD Software for Mac and Win
- Flowchart | Basic Flowchart Symbols and Meaning
- Flowchart | Flowchart Design - Symbols, Shapes, Stencils and Icons
- Flowchart | Flow Chart Symbols
- Electrical | Electrical Drawing - Wiring and Circuits Schematics
- Flowchart | Common Flowchart Symbols
- Flowchart | Common Flowchart Symbols