JSD - Jackson system development
Jackson System Development (JSD) is a linear method of system development created by Michael A. Jackson and John Cameron in the 1980s. It comprises the whole software life cycle directly or providing a framework for more specialized techniques.When implementing the Jackson System Development method and designing JSD diagrams, you can succesfully use the powerful and helpful tools of ConceptDraw PRO software extended with Entity-Relationship Diagram (ERD) solution from the Software Development area of ConceptDraw Solution Park.
Property Management Examples
This sample was created in ConceptDraw PRO diagramming and vector drawing software using the Seven Management and Planning Tools Solution from the Business Productivity area of ConceptDraw Solution Park.This sample shows the Property Management matrix, the ideas are ordered in regards to importance and frequency. This matrix gives the ability to turn the theory into quantifiable data.
Software development with ConceptDraw Products
Internet solutions on ConceptDraw base. What may interest developers of Internet solutions.Stakeholder Mapping Tool
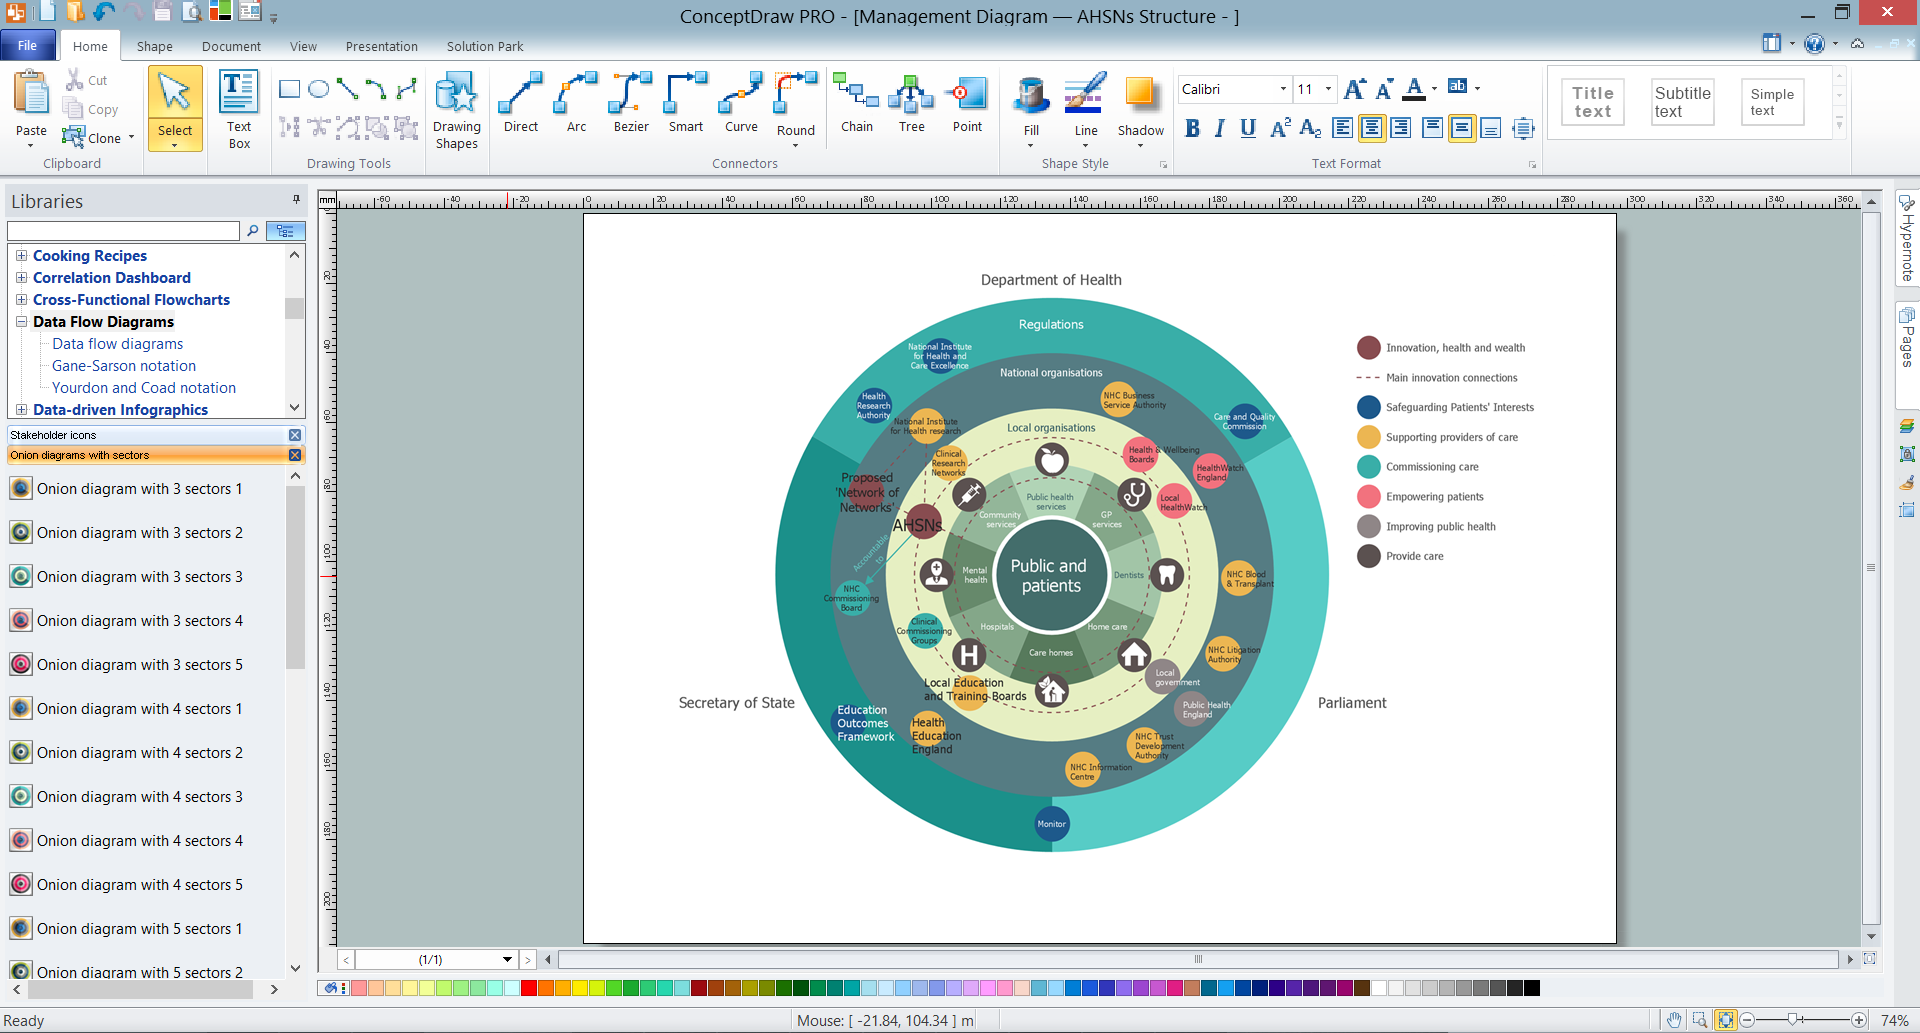
Stakeholders are the groups of people or organizations whose contribution matters to the organization's success, this can be labour participation, financial participation, dissemination of information about organization, etc. So, the employees of the company, its suppliers, customers, media, public organizations, state authorities, all they are stakeholders of the company.ConceptDraw PRO diagramming and vector drawing software extended with Stakeholder Onion Diagrams Solution from the Management Area of ConceptDraw Solution Park is a powerful stakeholder mapping tool which allows easy create Stakeholder Onion diagrams and maps depicting the layers of a project, relationships of stakeholders to a project goal, and relationships between stakeholders.
How To Draw Building Plans
Building Plans are a set of scaled drawings, which show a view from above, the relationships between rooms, spaces and other physical features at one level of a structure. Usually plans are drawn or printed on paper, but they can take the form of a digital file.Quick building plan software for creating great-looking office layout, home floor, electrical plan, commercial floor plans, Storage building plans, expo and shopping mall building plans, school and training building plans, cafe or restaurant plans, gym and spa area plans, sport field plans, electric and telecom building plans, fire and emergency plans, HVAC plans, security and access plans, plumbing and piping plans and plant layouts.

Software for Drawing EPC Diagrams
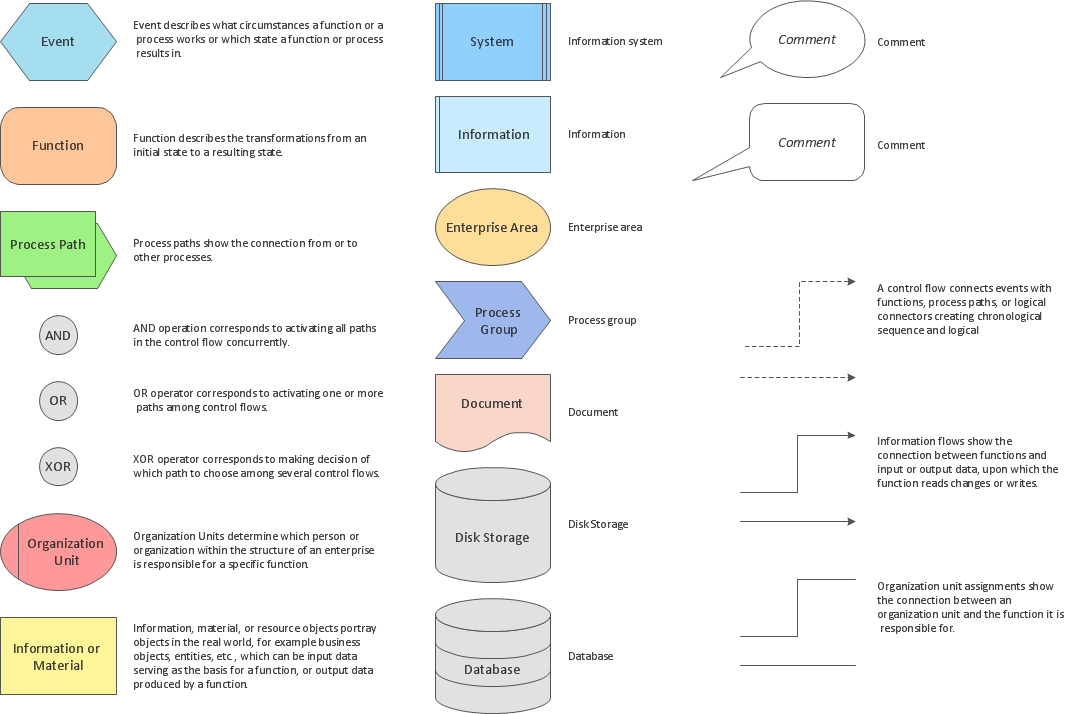
Event-Driven Process chain Diagrams for improvement throughout an organisation.ConceptDraw PRO - software that reduces the time needed to create a business process model.
UML Class Diagram Example - Buildings and Rooms
This sample was created in ConceptDraw PRO diagramming and vector drawing software using the UML Class Diagram library of the Rapid UML Solution from the Software Development area of ConceptDraw Solution Park.This sample shows the structure of the building and can be used by building companies, real estate agencies, at the buying / selling of the realty.
Line Chart Examples
The Line Graphs solution from Graphs and Charts area of ConceptDraw Solution Park contains a set of examples, templates and design elements library of line and scatter charts. Use it to draw line and scatter graphs using ConceptDraw PRO diagramming and vector drawing software for illustrating your documents, presentations and websites.ConceptDraw PRO ER Diagram Tool
ER-diagram is a tool used for database modeling which allows to determine data and relationships among the data. These diagrams help to detail data storages and to document all the properties of designed system. ER-diagram contains entities, attributes of the entities and the relationships between them. Chen’s notation and Crow’s foot notation are commonly used to represent elements in ER-model. To create such diagram you should use specific software, such as Entity-Relationship Diagram solution for ConceptDraw Pro.ConceptDraw ER Diagram Tool works across any platform, meaning you never have to worry about compatibility again. ConceptDraw PRO allows you to make Entity-Relationship Diagram (ERD) on PC or macOS operating systems.
 Social Media Response
This solution extends ConceptDraw DIAGRAM and ConceptDraw MINDMAP with the ability to draw interactive flow charts with action mind map templates, to help create an effective response to applicable social media mentions.
- Real Estate Analysis
- Real Estate Swot Analysis
- USA Maps | Porters Value Chain Analysis For Real Estate Company
- Value Chain For Real Estate Developer
- Product Positioning Map Luxury Real Estate
- Rapid UML | Sequence Duagram For Real Estate
- Rapid UML | Data Flow Diagram For Real Estate Management ...
- Rapid UML | Dfd For Real Estate Management System
- Rapid UML | Social Media Response | Www Reail Estate ...
- UML deployment diagram - Real estate transactions | How To Draw ...
- ERD | Entity Relationship Diagrams, ERD Software for Mac and Win
- Flowchart | Basic Flowchart Symbols and Meaning
- Flowchart | Flowchart Design - Symbols, Shapes, Stencils and Icons
- Flowchart | Flow Chart Symbols
- Electrical | Electrical Drawing - Wiring and Circuits Schematics
- Flowchart | Common Flowchart Symbols
- Flowchart | Common Flowchart Symbols


