 Event-driven Process Chain Diagrams
Event-driven Process Chain (EPC) Diagram is a type of flowchart widely used for modeling in business engineering and reengineering, business process improvement, and analysis. EPC method was developed within the Architecture of Integrated Information Systems (ARIS) framework.
Basic Flowchart Symbols and Meaning
Flowchart Symbols and Meaning - Provides a visual representation of basic flowchart symbols and their proposed use in professional workflow diagram, standard process flow diagram and communicating the structure of a well-developed web site, as well as their correlation in developing on-line instructional projects. See flowchart's symbols by specifics of process flow diagram symbols and workflow diagram symbols.
 Plant Layout Plans
This solution extends ConceptDraw PRO v.9.5 plant layout software (or later) with process plant layout and piping design samples, templates and libraries of vector stencils for drawing Plant Layout plans. Use it to develop plant layouts, power plant desig
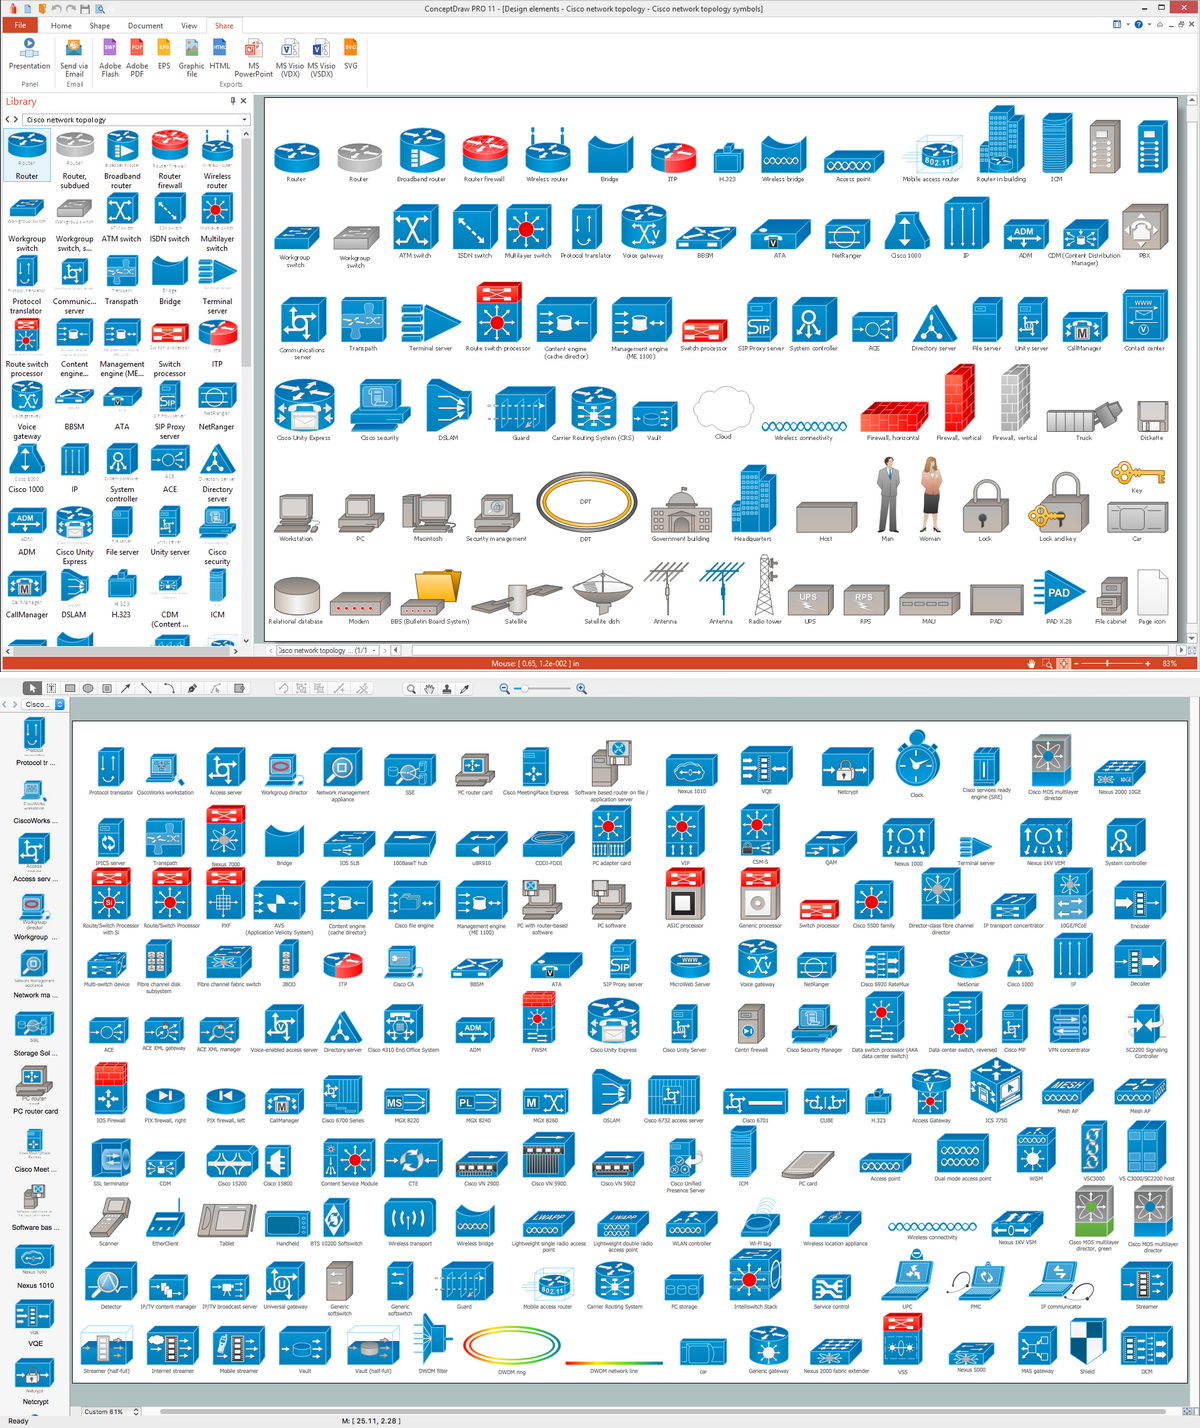
Cisco Network Topology. Cisco icons, shapes, stencils and symbols
The Cisco Network Diagrams solution uses Cisco network symbols and Cisco icons to visualize computer networks. Cisco Network Topology is the arrangement of the Cisco symbols that display scheme of computer network.Any Cisco equipment on the network are named like node. Network diagram topology commonly designed within connected nodes. Cisco icons are worldwide acknowledged and mainly established as standard icons for network diagrams. You may use them loosely, but you may not rework them.
The Cisco Network Diagram shows how signals act on the networked devices, or how data routes on the network from one device to the other. There are number of physical network typologies that engineers use while constructing computer networks.
 Entity-Relationship Diagram (ERD)
Entity-Relationship Diagram (ERD) solution extends ConceptDraw PRO software with templates, samples and libraries of vector stencils from drawing the ER-diagrams by Chen's and crow’s foot notations.
Entity Relationship Diagram - ERD - Software for Design Crows Foot ER Diagrams
Crow's Foot notation was proposed by Gordon Everest. According to this notation, the entity is represented by rectangle, relation is depicted by line which ties two entities involved in a relationship. Entity-relationship diagrams based on both Chen's and Crow's Foot notations, can be easily drawn using the ConceptDraw PRO ERD diagrams software tools for design element Crow's Foot and Chen from Entity-Relationship Diagram (ERD) solution.
- Data Flow Diagram Of Quiz System
- Entities Relationship Diagram Exam Management System Database
- Deploymemt Diagram In Uml For Quiz System
- Data Flow Diagram For Quiz Management System
- Online Examination System Diagrams
- Activity Diagram For Online Examination System
- Architecture Diagram For Exam Registration System
- UML Use Case Diagram Example Registration System | Exam ...
- Accounting Flowcharts | Mobile cloud architecture diagram ...
- Data Flow Diagram Software | Example of DFD for Online Store ...
- Exam Registration System Chart Diagram
- Quiz Application Flow Chart
- Flow Chart Quiz
- ERD Symbols and Meanings | Entity Relationship Diagram - ERD ...
- Sequence Diagram For Exam Registration System
- How to Create Flowcharts for an Accounting Information System ...
- Exam About Flowchart And Data Flow Diagram
- Process Flow Free Quiz
- Dfd Digram Of Online Quiz System
- UML Use Case Diagram Example Registration System | Timing ...
- ERD | Entity Relationship Diagrams, ERD Software for Mac and Win
- Flowchart | Basic Flowchart Symbols and Meaning
- Flowchart | Flowchart Design - Symbols, Shapes, Stencils and Icons
- Flowchart | Flow Chart Symbols
- Electrical | Electrical Drawing - Wiring and Circuits Schematics
- Flowchart | Common Flowchart Symbols
- Flowchart | Common Flowchart Symbols


_Win_Mac.png)