Bubble Chart Maker
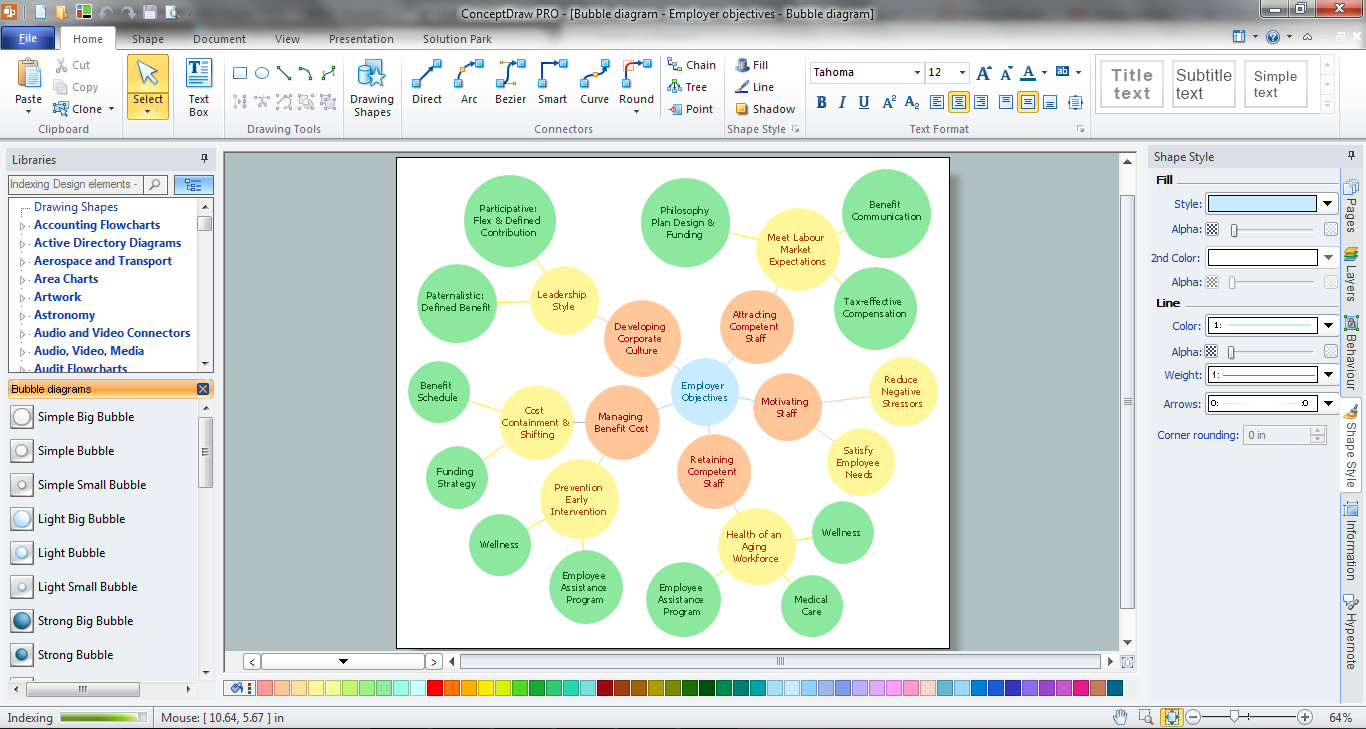
ConceptDraw PRO diagramming and vector drawing software extended with Bubble Diagrams Solution from the "What is a Diagram" Area is a powerful Bubble Chart Maker.Classroom Seating Chart Maker
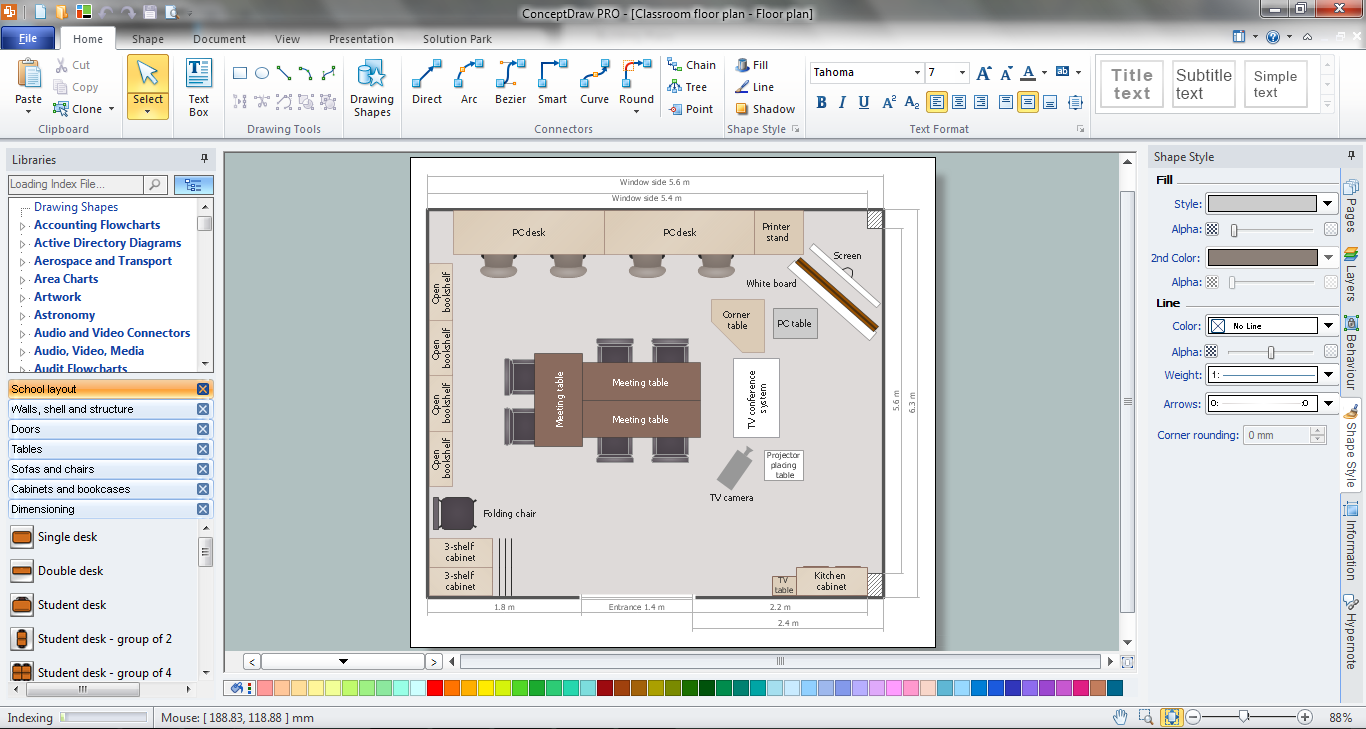
ConceptDraw PRO extended with School and Training Plans Solution from the Building Plans Area is a powerful Classroom Seating Chart Maker.Pyramid Chart Maker
ConceptDraw PRO is a powerful diagramming and vector drawing software which offers the extensive drawing tools for creating various types of diagrams. Extended with Pyramid Diagrams Solution from the Marketing Area, it became the best Pyramid Chart Maker.Chart Maker for Presentations
Easy charting software comes with beautiful chart templates and examples. This makes it easy to create professional charts without prior experience.Organizational Chart Templates
ConceptDraw offers you a number of ready-made organizational chart templates which you can use in your drawing. They are grouped in topical sets as organizational chart template files.Use the Organizational Charts Solution for ConceptDraw PRO to create your own Organizational Charts of any complexity quick, easy and effective.
The Organizational Charts designed with ConceptDraw PRO are vector graphic documents and are available for reviewing, modifying, converting to a variety of formats (image, HTML, PDF file, MS PowerPoint Presentation, Adobe Flash or MS Visio XML), printing and send via e-mail in one moment.

Onion Diagram Maker
The onion diagram is a type of diagram which shows the dependencies among parts of an organization or process. The items are displayed at the concentric circles, where the items at the bigger rings depend on the items at the smaller rings.ConceptDraw PRO diagramming and vector drawing software extended with Stakeholder Onion Diagrams Solution from the Management Area of ConceptDraw Solution Park is a professional Onion Diagram Maker.
Pie Chart Software
A pie chart is a circular diagram showing a set of data divided into proportional slices. There are several variations of this chart such as donut chart, exploded pie chart, multi-level pie charts. Although it is not very informative when a ring chart or circle chart has many sections, so choosing a low number of data points is quite important for a useful pie chart.ConceptDraw PRO software with Pie Charts solution helps to create pie and donut charts for effective displaying proportions in statistics, business and mass media for composition comparison, i.e. for visualization of part percentage inside one total.
Target Diagram
Target Diagram is a convenient and visual way of presentation information which is popular and widely used in marketing, business and economics. ConceptDraw PRO diagramming and vector drawing software extended with Target and Circular Diagrams solution from the Marketing area of ConceptDraw Solution Park is ideal for fast and easy drawing a Target Diagram.Classroom Seating Chart
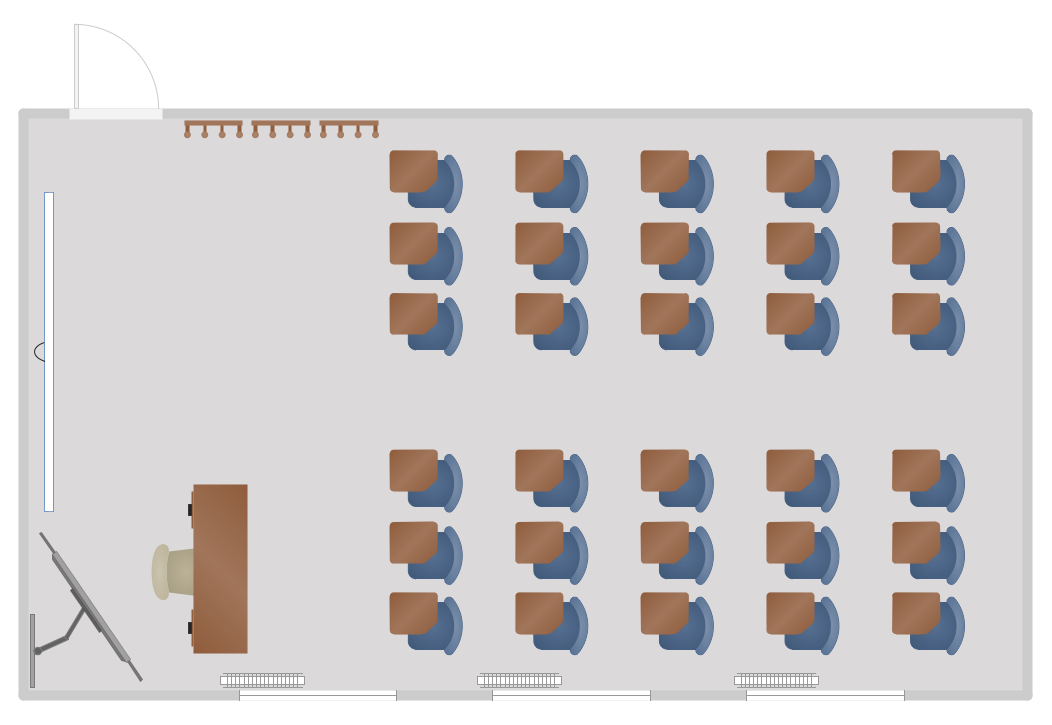
When developing the Classroom Seating Chart it is necessary to take into account the characteristics of the taken premises. Each seating place must to be comfortable and each pupil must to see good the teacher and the chalkboard. Let's design the Classroom Seating Chart in ConceptDraw PRO software extended with School and Training Plans Solution from the Building Plans Area.Line Chart Template for Word
This sample was created in ConceptDraw PRO diagramming and vector drawing software using the Line Graphs Solution from Graphs and Charts area of ConceptDraw Solution Park.This sample shows the Line Chart of annual percentage change. The Line Chart allows you to clearly see the changes of data over the time.
Infographic Maker
Infographic is a visual way of representing various information, data, knowledge in statistics, geography, journalism, education, and much more areas. ConceptDraw PRO supplied with Pictorial Infographics Solution from the “What are Infographics” Area, provides a set of powerful pictorial infographics tools. Thanks to them it is the best Infographic Maker.Seating Chart Template
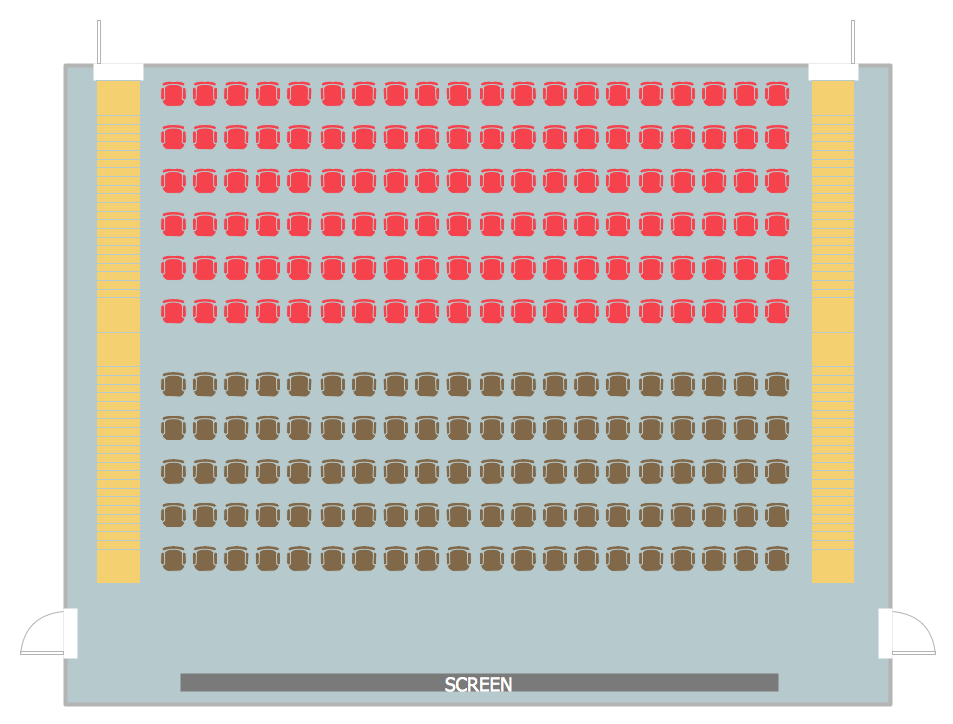
Seating chart developing is necessity for constructing and building the cinemas, theaters, banquet halls, auditoriums, and other premises for accommodation a large number of people. Seating chart template can help you design professional looking seating plan. ConceptDraw PRO diagramming and vector drawing software recommends you to use the Seating Plans solution from the Building Plans area for designing the seating charts.Pie Chart Word Template. Pie Chart Examples
The Pie Chart visualizes the data as the proportional parts of a whole and looks like a disk divided into sectors. The pie chart is type of graph, pie chart looks as circle devided into sectors. Pie Charts are widely used in the business, statistics, analytics, mass media. It’s very effective way of displaying relative sizes of parts, the proportion of the whole thing.Stakeholder Management System
Stakeholder management is a critical component to the successful delivery of any project, programme or activity.ConceptDraw PRO is a powerful diagramming and vector drawing software. Now, thanks to the Stakeholder Onion Diagrams Solution included to the Management Area of ConceptDraw Solution Park, ConceptDraw PRO became also unique stakeholder management system design software.
Diagramming Software for Design UML Collaboration Diagrams
ConceptDraw helps you to start designing your own UML Collaboration Diagrams with examples and templates.
- Basic Diagramming | Venn Diagram Maker | Onion Diagram Maker ...
- Chart Maker for Presentations | Pie Charts | Pie Chart Examples and ...
- Infographic Maker | How to Draw Pictorial Chart . How to Use ...
- Classroom Seating Chart Maker | Bubble Chart Maker | Pyramid ...
- Chart Maker for Presentations | Sales Growth. Bar Graphs Example ...
- Chart Maker for Presentations | Pie Charts | Design elements ...
- Line Graph Charting Software | Line Chart Template for Word | Chart ...
- Chart Maker for Presentations | Stacked Graph | Chart Templates ...
- Importance Of Bubble Diagram In Design
- Chart Maker for Presentations | Pie Chart Examples and Templates ...
- Dfd Diagram Tools On Mac
- School Floor Plans | Emergency Plan | Classroom Seating Chart ...
- Flow Chart Maker Freeware
- Bar Chart Template for Word | Chart Maker for Presentations ...
- Chart Maker for Presentations | Bar Diagrams for Problem Solving ...
- Chart Maker for Presentations | Chart Software for Better ...
- Free Organizational Chart Maker
- Classroom Seating Chart Maker | Bar Chart Software | Building ...
- Marketing Diagrams | Marketing Charts | Marketing Flow Chart ...
- Bar Charts Powerpoint
- ERD | Entity Relationship Diagrams, ERD Software for Mac and Win
- Flowchart | Basic Flowchart Symbols and Meaning
- Flowchart | Flowchart Design - Symbols, Shapes, Stencils and Icons
- Flowchart | Flow Chart Symbols
- Electrical | Electrical Drawing - Wiring and Circuits Schematics
- Flowchart | Common Flowchart Symbols
- Flowchart | Common Flowchart Symbols


