Basic Flowchart Symbols and Meaning
Flowchart Symbols and Meaning - Provides a visual representation of basic flowchart symbols and their proposed use in professional workflow diagram, standard process flow diagram and communicating the structure of a well-developed web site, as well as their correlation in developing on-line instructional projects. See flowchart's symbols by specifics of process flow diagram symbols and workflow diagram symbols.
Process Flowchart
ConceptDraw is Professional business process mapping software for making process flow diagram, workflow diagram, general flowcharts and technical illustrations for business documents. It is includes rich examples, templates, process flowchart symbols. ConceptDraw flowchart maker allows you to easier create a process flowchart. Use a variety of drawing tools, smart connectors, flowchart symbols and shape libraries to create flowcharts of complex processes, process flow diagrams, procedures and information exchange.
Definition TQM Diagram
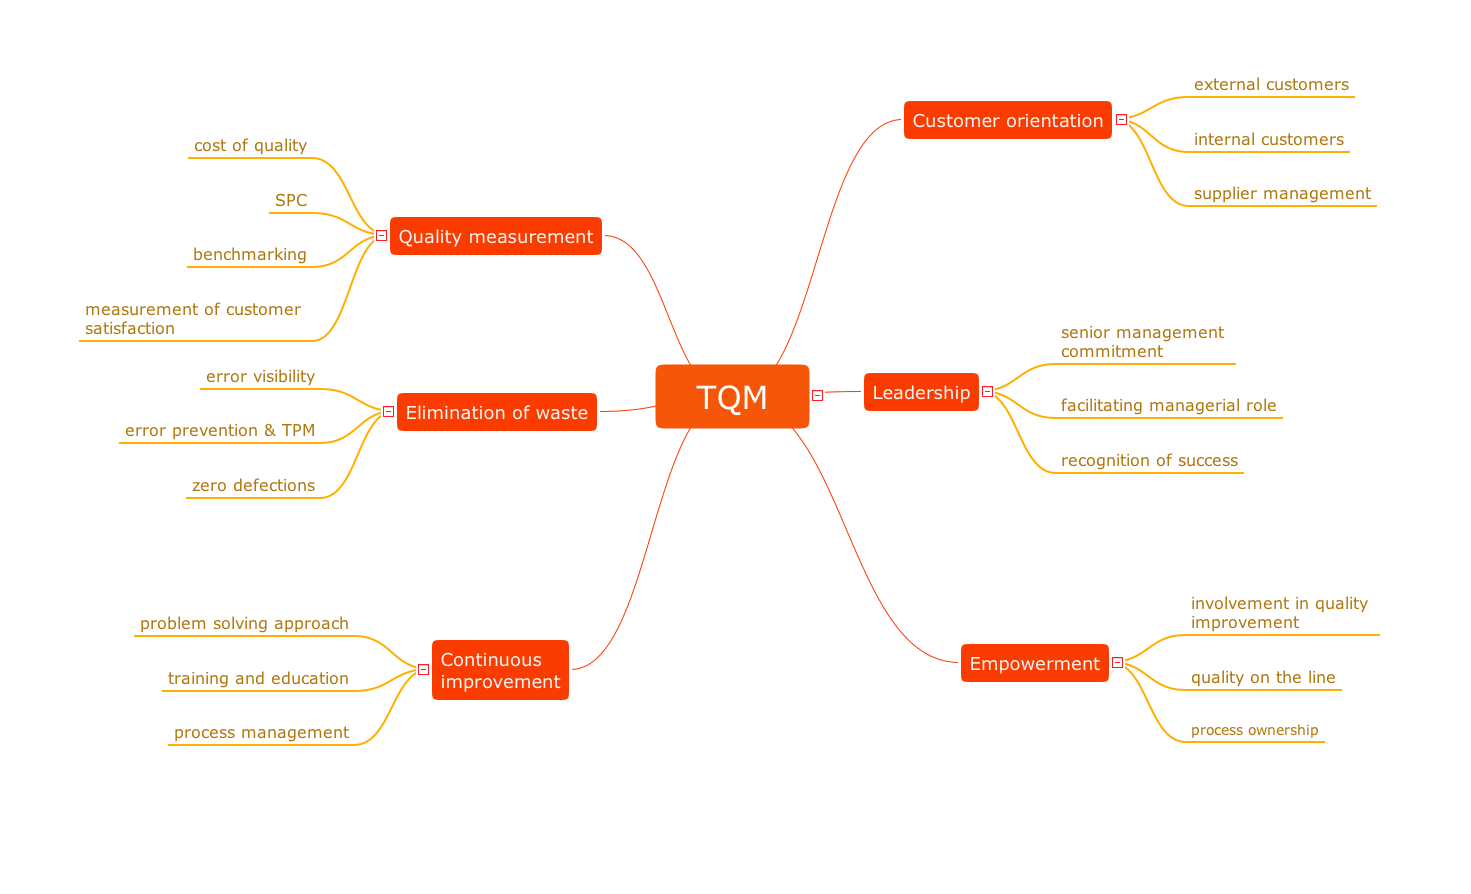
The Total Quality Management Diagram solution helps your organization visualize business and industrial processes. Create Total Quality Management diagrams for business process with ConceptDraw software.Total Quality Management Definition
Total quality management is the one known to be consisting of some organization-wide efforts put in order to install and to make some climate in which this organization can continuously improve its ability to deliver the high-quality products and services to its customers permanently.Organizational Structure Total Quality Management
The Total Quality Management Diagram solution helps you and your organization visualize business and industrial processes. Create Total Quality Management diagrams for business process with ConceptDraw software.Quality Improvement
Constant improvement of key performance indicators that are related to quality is a step in the right direction for a company interested in market growth.Business Process Flowchart Symbols
The business process flowchart symbols used for business process mapping are predefined by Business Process Modeling Notation (BPMN) and actually have their roots in the data processing diagrams and programming flow charts. Business Process flowchart symbols provide drawing business process flowcharts, diagrams and maps of any complexity.Quality Management Teams
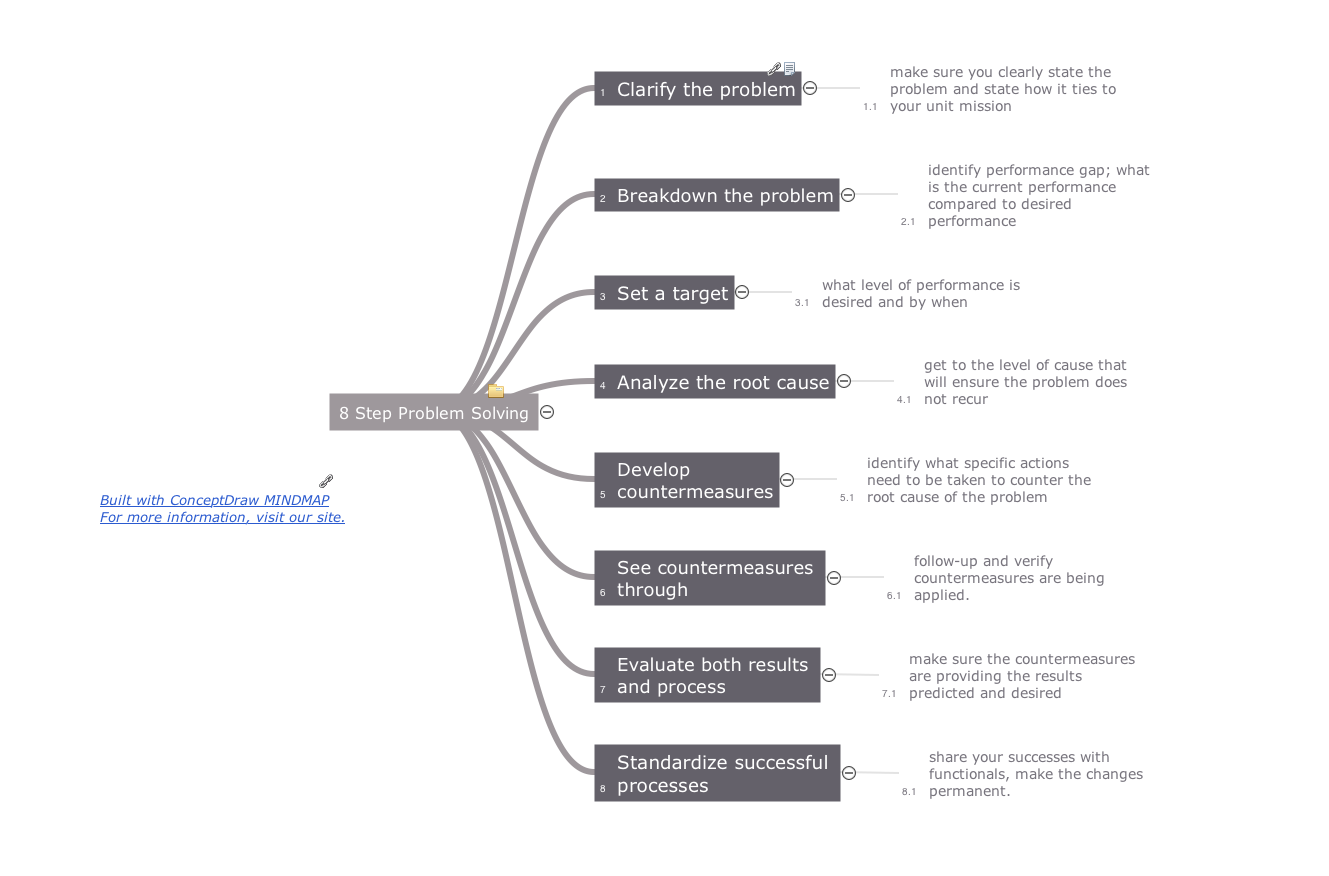
ConceptDraw MINDMAP with Quality mindmaps solution as a demonstration of the creative approach to quality management in daily work of quality management team.Helpful in all stages of quality management
ConceptDraw Mind maps can be used to depict a quality process.Value Stream Mapping Symbols
VSM symbols are the best for a production process designing. The entire Value Stream Mapping method uses a graphical representation of the manufacturing process, factors' pros and cons, that all stakeholders can easily understand. Value Stream Mapping is a graphical technique that provides possibilities to improve analysis of a manufacturing process, at the stage of the transferring information or materials that required to deliver a product or service to the customer.Identifying Quality Management System
The Total Quality Management Diagram solution helps your organization visualize business and industrial processes. Create Total Quality Management diagrams for business process with ConceptDraw software.Quality Control
Using mind mapping for quality management is a creative approach that allows one to structure all key quality points on the one page.Workflow Diagram Symbols
Workflow diagrams is the acknowledged method to draw processes which have concerted set of symbols you use for depicting different kind of steps or relations. Often it named the process flow diagram but the real process flow diagram use differen visual notations and use different flowchart symbols. The professional workflow diagram also may be used for the same purpose as critical process flow diagram. Nevertheless, there are lots of cases you may need make your workflow diagram more bright and graphic. ConceptDraw PRO extended with the Workflow Diagram solution delivers rich set of workflow diagram symbols helps you make your workflow better-suited for presentations.Workflow Diagram
Workflow diagram visually describes an repeatable pattern of organizational activity powered by resources. Workflow diagram explains and document the process flow which needs to be organized or exists and needs to be learned and executed. Workflow diagram can be part of project documentation, company policies or sertification process to comply a standard.The workflow represents the transferring of data, documents or tasks during a work process. To make it easier to study and analyze working processes, and to present them in a simple visual manner, workflow diagrams are used. To create these diagrams professional use workflow diagram maker software ConceptDraw PRO.
Context Diagram Template
This template shows the Context Diagram. It was created in ConceptDraw PRO diagramming and vector drawing software using the Block Diagrams Solution from the “Diagrams” area of ConceptDraw Solution Park.
The context diagram graphically identifies the system. external factors, and relations between them. It’s a high level view of the system. The context diagrams are widely used in software engineering and systems engineering for designing the systems that process the information.
- Quality Drawing Symbol
- Basic Flowchart Symbols and Meaning | Audit Flowchart Symbols ...
- Show The Flow Chart Symbols Of For Loop
- Flow Chart Symbols | Technical Flow Chart Example | Design ...
- Show 8 Symbols Of Flowcharting And Their Functions
- Symbol Used In Quality Department
- Quality Symbol In Pdf
- Basic Flowchart Symbols and Meaning | Audit Flowchart Symbols ...
- Quality Symbol Mechanical Engineer
- Quality Symbols Drawings
- Process Flowchart | Quality Symbol For Cnc Machines
- Mechanical Engineering Quality Symbol
- Basic Flowchart Symbols and Meaning | Process Flow Chart ...
- Process Flowchart | Definition TQM Diagram | TQM Software ...
- Mech Engg Quality Symbols
- Show The Flowchart Symbols Of The Control Structure For Loop
- Process Flowchart | Probability Quality Control Tools | Quality ...
- Engineering Symbols For Quality Control
- Mechanical Component Quality Symbols
- Mathematical Diagrams | Mathematics Symbols | Management Tools ...
- ERD | Entity Relationship Diagrams, ERD Software for Mac and Win
- Flowchart | Basic Flowchart Symbols and Meaning
- Flowchart | Flowchart Design - Symbols, Shapes, Stencils and Icons
- Flowchart | Flow Chart Symbols
- Electrical | Electrical Drawing - Wiring and Circuits Schematics
- Flowchart | Common Flowchart Symbols
- Flowchart | Common Flowchart Symbols


