This site uses cookies. By continuing to browse the ConceptDraw site you are agreeing to our Use of Site Cookies.

How Do Fishbone Diagrams Solve Manufacturing Problems

How do Fishbone diagrams solve manufacturing problems? Fishbone diagrams are successfully used in various fields of industries and manufacturing to analyze the set of possible causes and their effects. Fishbone diagram provides a process to clearly define the “Effect” and then puts you to thinking about the possible causes, based on the categories of common problems in manufacturing.
ConceptDraw DIAGRAM application extended with Fishbone Diagrams solution lets you construct Fishbone diagrams and represent globally recognized standards for manufacturing 6 Ms and 8 Ms.

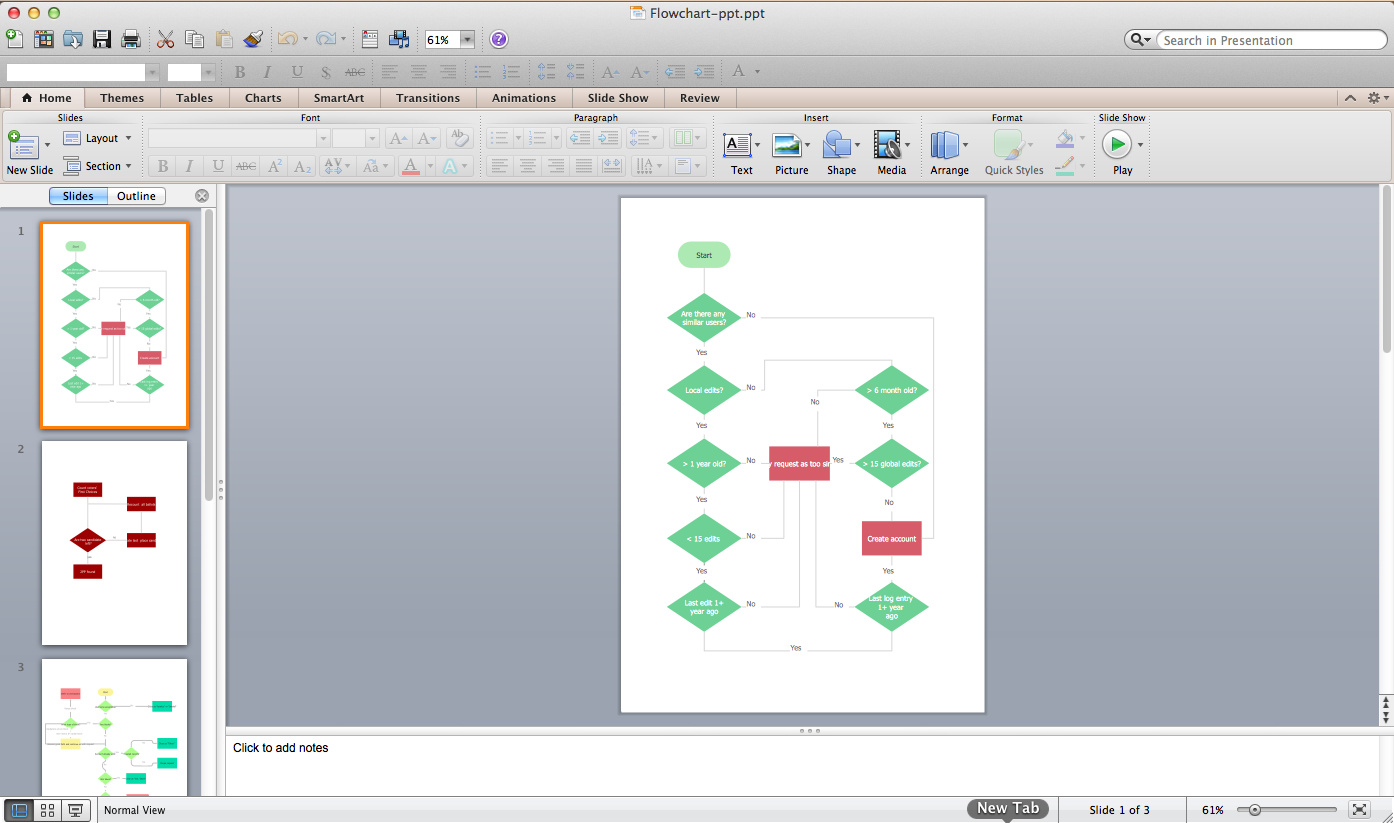
Flowcharts in PowerPoint
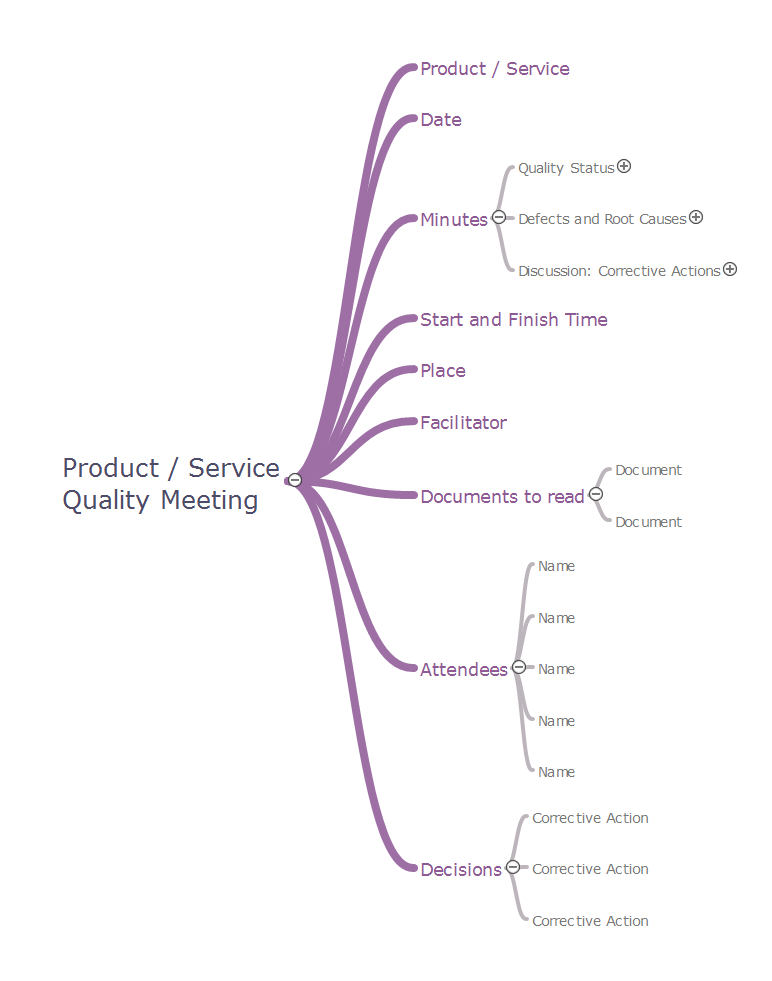
To create flowcharts in MS PowerPoint, programs designed specifically for the purpose of creating flowcharts are particularly well-suited to the task.

Quality meeting

With this mind map template, you can quickly prepare for quality meetings by filling in the appropriate fields. By using this mind map to take notes during the meeting, you'll be able to send a one-page summary to meeting participants or use later to present the material, yourself, to a different audience.

Fishbone Diagram Template

A causal model is an abstract concept, that describes the causal mechanisms of a system, by noting certain variables and their influence on each other, in an effort to discover the cause of a certain problem or flaw. This model is presented in diagram form by using a fishbone diagram.
ConceptDraw DIAGRAM diagramming and vector drawing software enhanced with Fishbone Diagrams solution helps you create business productivity diagrams from Fishbone diagram templates and examples, that provide to start using of the graphic method for the analysis of problem causes. Each predesigned Fishbone Diagram template is ready to use and useful for instantly drawing your own Fishbone Diagram.

Total Quality Management

This mind map demonstrates how the well-known Total Quality Management (TQM) methodology can be presented in a mind map. Using mind mapping for quality management is a creative approach that allows one to structure all key quality points on the one page.

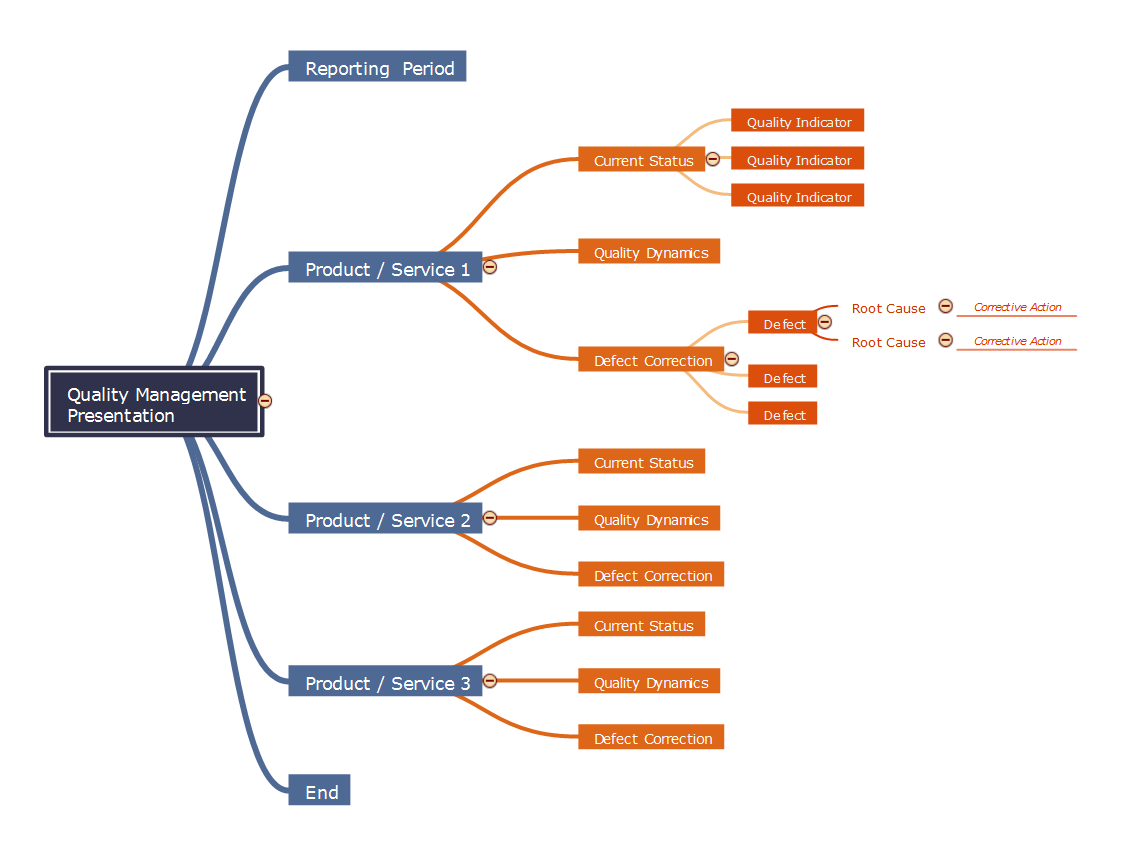
Quality management presentation

By filling in this template, it is easy to quickly prepare a presentation about any quality process in your company.

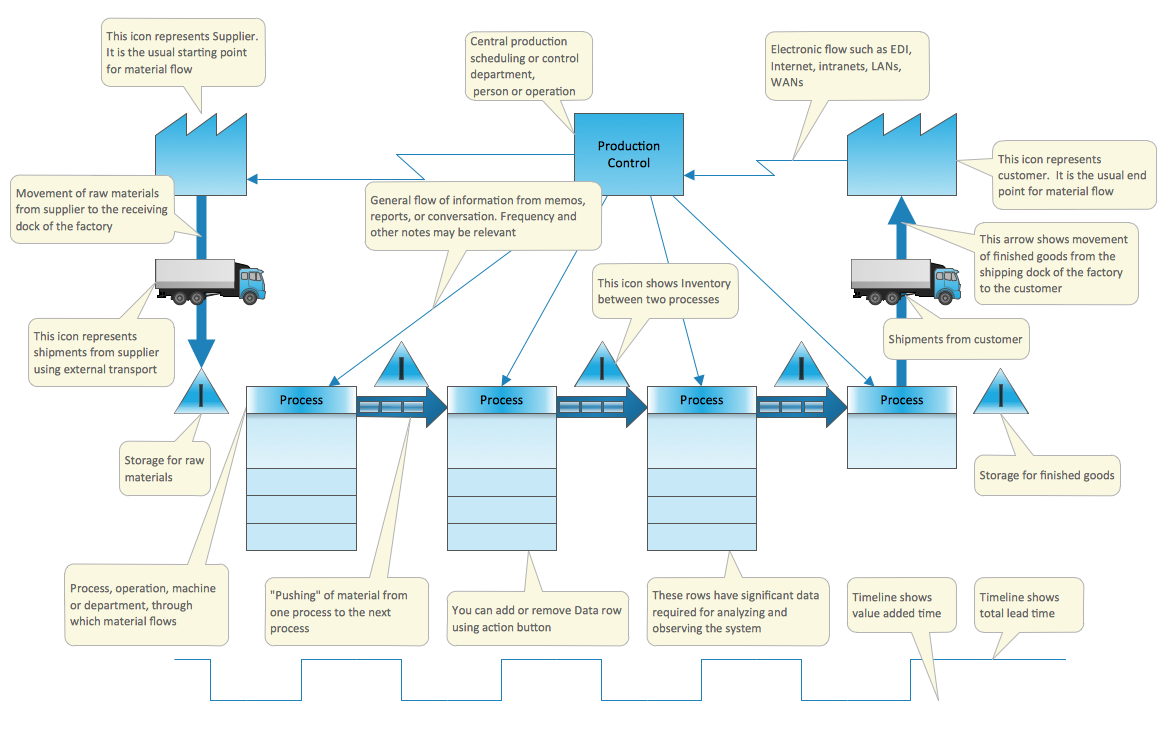
Value Stream Mapping Template

Use ConceptDraw DIAGRAM extended with Value Stream Mapping solution for document processes with professional designed Value Stream Mapping template.

8 Step Problem Solving

This mind map shows 8 steps approach to solving any kind of product or service problems.

Value-Stream Mapping for Manufacturing

Create value stream maps - for value stream analysis and value stream management, material and information flow mapping, using our quick start templates included with ConceptDraw.

Process Flowchart

ConceptDraw is Professional business process mapping software for making process flow diagram, workflow diagram, general flowcharts and technical illustrations for business documents. It is includes rich examples, templates, process flowchart symbols. ConceptDraw flowchart maker allows you to easier create a process flowchart. Use a variety of drawing tools, smart connectors, flowchart symbols and shape libraries to create flowcharts of complex processes, process flow diagrams, procedures and information exchange.
How To Create a Process Flow Chart (business process modelling techniques)