This site uses cookies. By continuing to browse the ConceptDraw site you are agreeing to our Use of Site Cookies.

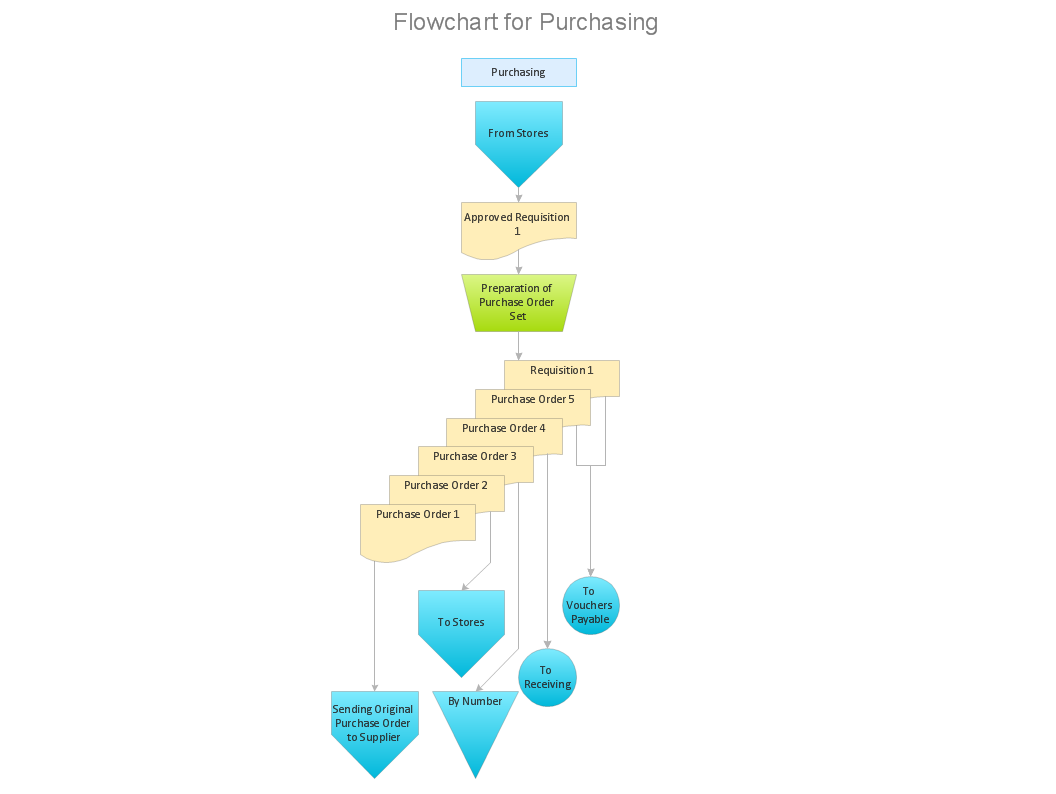
Purchasing Flowchart - Purchase Order. Flowchart Examples

Create your own flow charts of purchasing business processes using the ConceptDraw DIAGRAM diagramming and vector drawing software extended with the Accounting Flowcharts solution from the Finance and Accounting area of ConceptDraw Solution Park.
The flow chart example shows the steps of purchasing business process.

Material Requisition Flowchart. Flowchart Examples

Create your own material requisition flow charts using the ConceptDraw DIAGRAM diagramming and vector drawing software extended with the Flowcharts solution from the Diagrams area of ConceptDraw Solution Park.
The flowchart example shows the material requisition business process.

Purchase Process Flow Chart, Receiving Process Flow Chart, Accounting Flowchart Example.

The purchasing process follows very specific guidelines and includes a purchasing cycle flowchart and receiving process flow chart. Common key elements of purchasing process.
It is important to know how purchasing processes work and how each operation is done.

Integration Definition

Creation of various types of Integration DEFinition (IDEF) diagrams - IDEF0, IDEF1X, IDEF2, IDEF3 and many other is a sufficiently complex process that requires powerful automated tools. ConceptDraw DIAGRAM diagramming and vector drawing software offers you such tool - IDEF Business Process Diagrams solution from the Business Processes area of ConceptDraw Solution Park.

How to Create Flowcharts for an Accounting Information System

Accounting information is a system of processes to represent financial and accounting data that is used by decision makers. To represent accounting processes there are special symbols which are used to create accounting flowcharts.
Flowcharts help users of Accounting Information System to understand the step sequences of accounting processes. Use ConceptDraw DIAGRAM with Accounting Flowcharts solution to document and communicate visually how accounting processes work, and how each operation is done.

Why Flowchart Important to Accounting Information System?

The Accounting flowchart shows how information flows from source documents through the accounting records. The are based on the accounting procedures or processes.

Flowcharts are used to represent accounting information in a system. There are special symbols which are used to create accounting flowcharts. Try conceptdraw flowcharting set of symbols to draw a professional charts.

sales funnel, funnel, business funnel, funnel chart, funnel diagram, funnel management, lead funnel, marketing and sales funnel, marketing sales funnel, sales funnel examples, sales funnel stages Funnel Diagrams

sales funnel, funnel, business funnel, funnel chart, funnel diagram, funnel management, lead funnel, marketing and sales funnel, marketing sales funnel, sales funnel examples, sales funnel stages
Funnel Diagrams solution including wide range of funnel diagram samples, sales funnel examples, and vector design elements, makes the ConceptDraw DIAGRAM ideal for funnel management and creation the Funnel Diagrams of different types and designs, AIDA Model, AIDAS, ACCA Dagmar, Rossiter-Percy Model, Sales funnel, Marketing funnel, Search funnel, Brand funnel, Purchase funnel, Lead funnel, Conversion funnel, Business funnel, etc. You are free to choose to place your funnel object horizontally or vertically, you can use the objects with desired quantity of sales funnel stages, as well as to modify their size, color filling, and other parameters to make exceptionally looking Funnel diagrams fully responding to your desires.

Accounting Flowchart Symbols

If you deal everyday with accounting procedures, you might come to that point when you have to draw an accounting flowchart mentioning all the necessary details for getting the right result and in order to succeed in your field of business activity. Making it is truly simple in case you have ConceptDraw DIAGRAM which is a unique software that allows you to create any kinds of charts and flowcharts as well as schemes, diagrams and plans. This product is so special that once you start using it, you will understand the way it works quick and will never need any other software for the purpose of creating all mentioned above to see as a result incredible, smart, professional, sophisticated flowchart.

Data Flow Diagram

Data flow diagram (DFD) is the part of the SSADM method (Structured Systems Analysis and Design Methodology), intended for analysis and information systems projection. Data flow diagrams are intended for graphical representation of data flows in the information system and for analysis of data processing during the structural projection. Data flow diagram often used in connection with human process and can be displayed as workflow diagram. The critical Process Flow Diagram is another flowchart technique for designing data flow in connection with organizational processes. The critical Process flow diagram may use different range of symbols than a classic workflow diagram.

What can go wrong if the purchasing process is not followed?

Make sure that your purchasing process complies with the standards and regulations. Common key elements of purchasing process.