Concept Mapping


"Teamwork is "work done by several associates with each doing a part but all subordinating personal prominence to the efficiency of the whole" .
In a business setting accounting techniques may be used to provide financial measures of the benefits of teamwork which are useful for justifying the concept. Teamwork is increasingly advocated by health care policy makers as a means of assuring quality and safety in the delivery of services..." [Teamwork. Wikipedia]
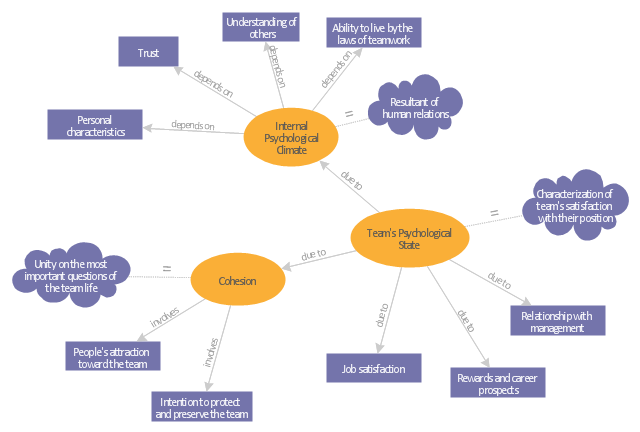
The concept map example "Team psychological characteristics" was created using the ConceptDraw PRO diagramming and vector drawing software extended with the Concept Maps solution from the area "What is a Diagram" of ConceptDraw Solution Park.
In a business setting accounting techniques may be used to provide financial measures of the benefits of teamwork which are useful for justifying the concept. Teamwork is increasingly advocated by health care policy makers as a means of assuring quality and safety in the delivery of services..." [Teamwork. Wikipedia]
The concept map example "Team psychological characteristics" was created using the ConceptDraw PRO diagramming and vector drawing software extended with the Concept Maps solution from the area "What is a Diagram" of ConceptDraw Solution Park.
Concept map
Concept Map

How to draw a Concept Map quick, easy and effective? ConceptDraw PRO offers the unique Concept Maps Solution from the "Diagrams" Area that will help you!
 Concept Maps
The technique of concept mapping was developed as a constructive way of representing knowledge in science and increasing the meaningfulness of learning. Now, the creation of a concept map is extremely helpful when used in education as learning and teaching techniques that assist memorization. Concept maps are also used for idea generation in brainstorming sessions, and for detailing the structure of complex ideas.
ConceptDraw Arrows10 Technology

How To Make a Concept Map

HelpDesk
How to Create a Concept Map in ConceptDraw PRO

HelpDesk
How To Create a Concept Map in Visio

Process Flowchart


3 Circle Venn. Venn Diagram Example

Simple Drawing Applications for Mac

 Block Diagrams
Block diagrams solution extends ConceptDraw PRO software with templates, samples and libraries of vector stencils for drawing the block diagrams.
Technical Flow Chart

Technical Flow Chart can be drawn by pencil on the paper, but it will be easier to use for designing a special software. ConceptDraw PRO diagramming and vector drawing software extended with Flowcharts Solution from the "Diagrams" Area of ConceptDraw Solution Park will be useful for this goal.
Business Process Flowchart

The flowcharts are divided into rows/columns of functional units. Blocks of various shapes represent the process steps, and are placed in rows/columns of the responsible functional units.
- Psychology Perspective Concept Map
- Biology Drawing | Concept Maps | Block Diagrams | Swot In ...
- Biology Drawing | Simple Drawing Applications for Mac | Concept ...
- Educational Psychology Concept Map
- Concept Mapping | Concept Maps | Process Flowchart | Psychology ...
- Process Flowchart | Scientific Symbols Chart | Concept Maps ...
- Concept Map | Concept Mapping | ConceptDraw Arrows10 ...
- The Best Choice for Creating Diagram | Concept Mapping ...
- Concept Mapping | The Best Choice for Creating Diagram ...
- Business Psychology Concept Map Sample
- Concept Map For Psychology Basic
- Concept Mapping | Team psychological characteristics - Concept ...
- Block Diagrams | Sample Of Creative Swot Analysis In Psychology
- Concept Mapping | Concept Map | The Best Choice for Creating ...
- Concept Mapping | Concept Maps | Physics Diagrams | Concept ...
- Biology Drawing | Concept Maps | Block Diagrams | Swot Analysis ...
- Team psychological characteristics - Concept map | Safety and ...
- Process Flowchart | Block Diagrams | Concept Maps | Psychology ...
- A Concept Map On The Science Of Psychology
- Concept Map In Biochemistry
- ERD | Entity Relationship Diagrams, ERD Software for Mac and Win
- Flowchart | Basic Flowchart Symbols and Meaning
- Flowchart | Flowchart Design - Symbols, Shapes, Stencils and Icons
- Flowchart | Flow Chart Symbols
- Electrical | Electrical Drawing - Wiring and Circuits Schematics
- Flowchart | Common Flowchart Symbols
- Flowchart | Common Flowchart Symbols