How To Create Project Report
ConceptDraw PROJECT contains an extensive tool set to help project managers. The rich data visualization capability that is provided by ConceptDraw products helps you create project dashboards, one-click reports, multi-project views, Gantt charts, and resource views. Let′s learn how to get maximum value using ConceptDraw PROJECT!HelpDesk
How to Track Your Project Plan vs. the Actual Project Condition
Conceptdraw PROJECT allows to follow how the project is going. You can easily compare the actual project data with the planned ones. The best tool for effective tracking of the project execution is to compoare real data with project baseline. It consists from the baseline start, baseline finish and baseline cost. Along with Baseline tracking ConceptDraw PROJECT offers several types of visual reports that can help to assess visually the difference between planned and actual project data.HelpDesk
How to Publish Project Reports on the Web Using ConceptDraw PRO
Reporting is an important part of project management. Every project manager is regularly asked how the project is progressing. ConceptDraw Office offers different ways in which to provide a project status.HelpDesk
How to Create Project Dashboard on PC
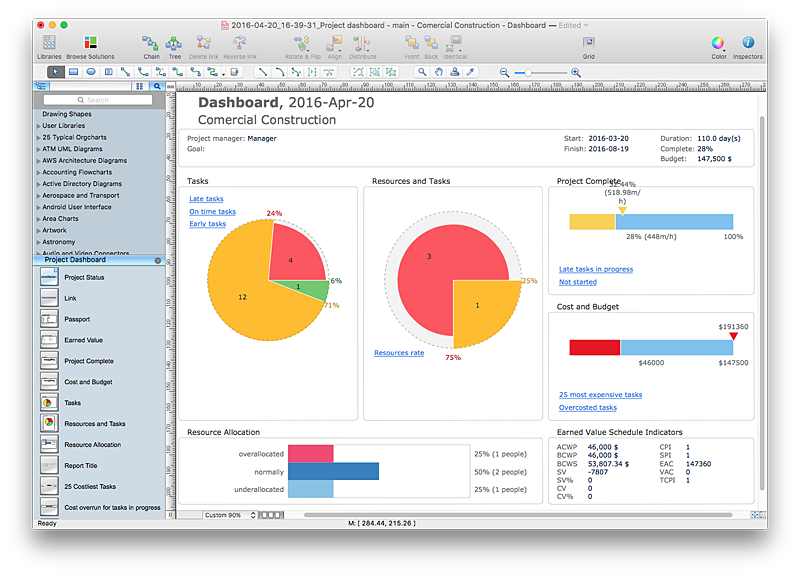
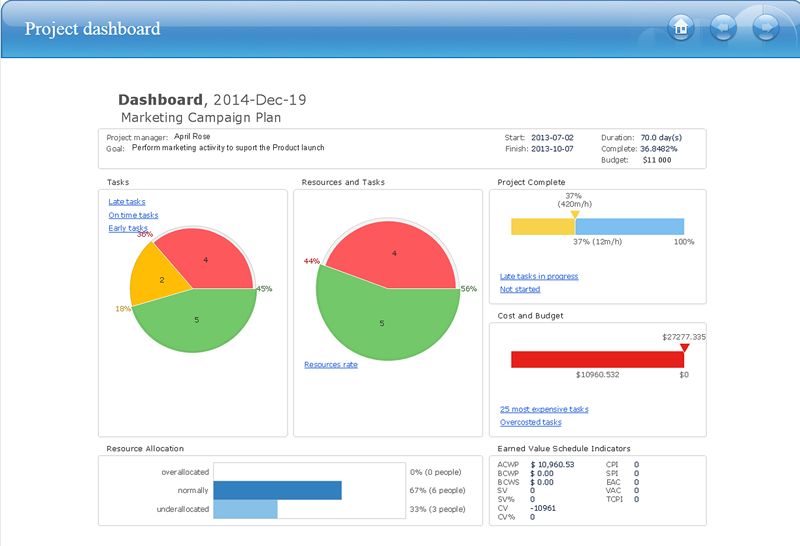
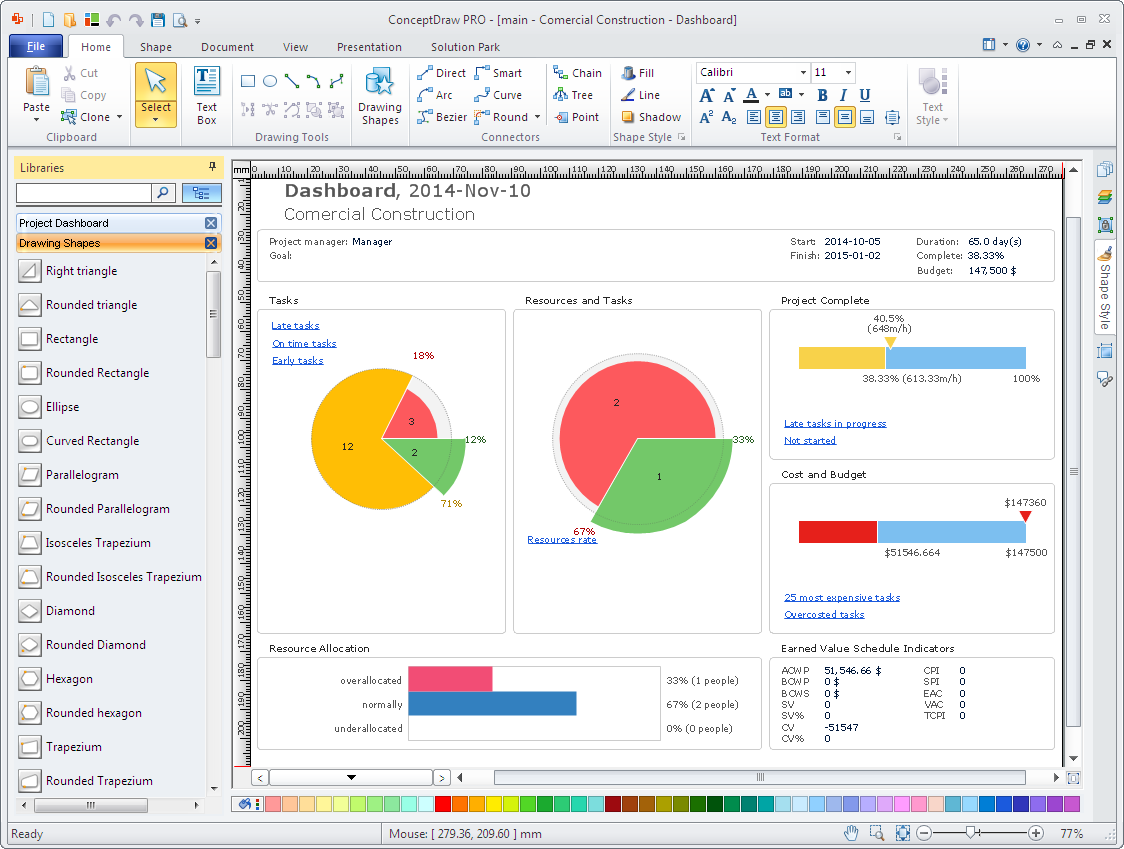
The visual Project Dashboard within ConceptDraw Office is the best way to deliver a clear view of project performance to all project participants.HelpDesk
How to Manage Multiple Projects on Windows
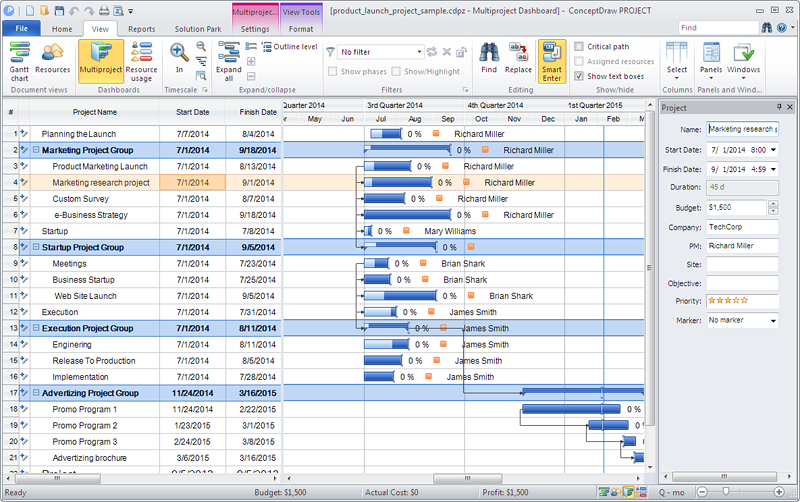
ConceptDraw PROJECT lets you to track multiple projects at the same time.HelpDesk
How to Generate ConceptDraw PROJECT Standard Reports on Mac
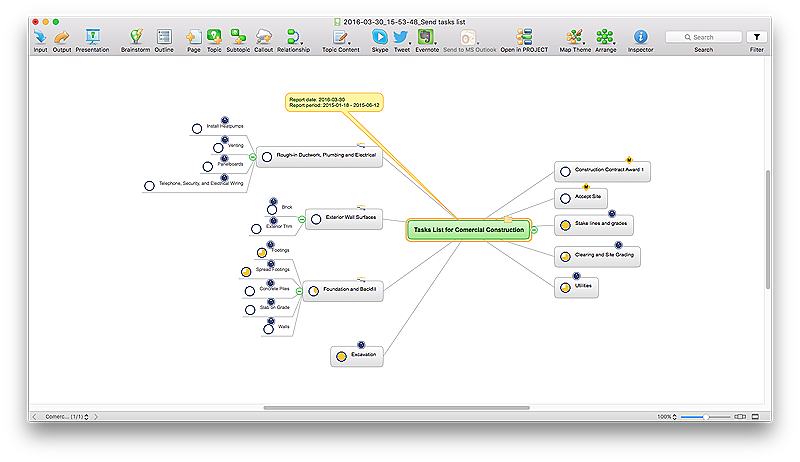
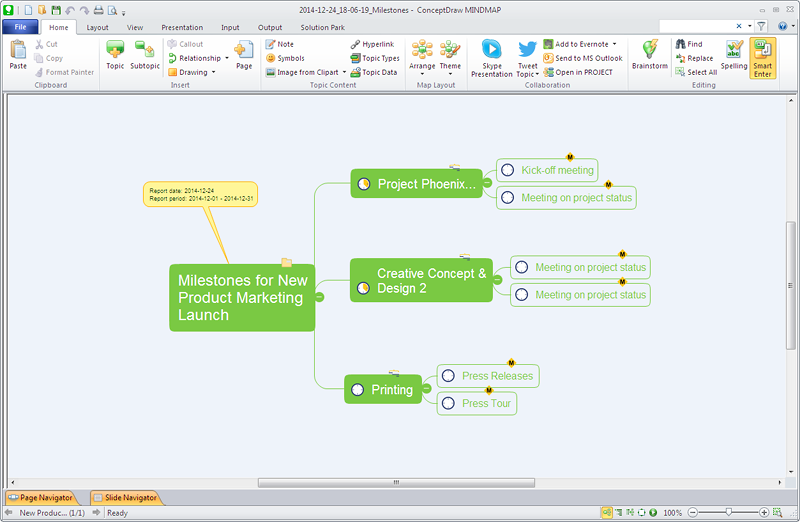
Project reporting is one of the key functions of effective project management. Using regular project reports, project manager can constantly track and analyze the project’s execution. This analytic process can help to ensure that the team reaches the best possible solutions. ConceptDraw PROJECT is a professional software tool for project management with the advanced mechanism of reporting. You can create the set of regular reports on project activities, task statuses, cash flow and assignments in MS Excel format. Mind map reports are also available.How to Report Task's Execution with Gantt Chart
ConceptDraw PROJECT’s powerful reporting engine lets you generate a set of tabular reports with just one click, or visualize your project as Radial Tasks Structures, Work Breakdown Structures and Resource Calendars. It also provides you with dynamic Project Dashboards.
 PM Dashboards
This solution extends ConceptDraw PRO and ConceptDraw PROJECT software with the ability to clearly display the identified key performance indicators for any project.
HelpDesk
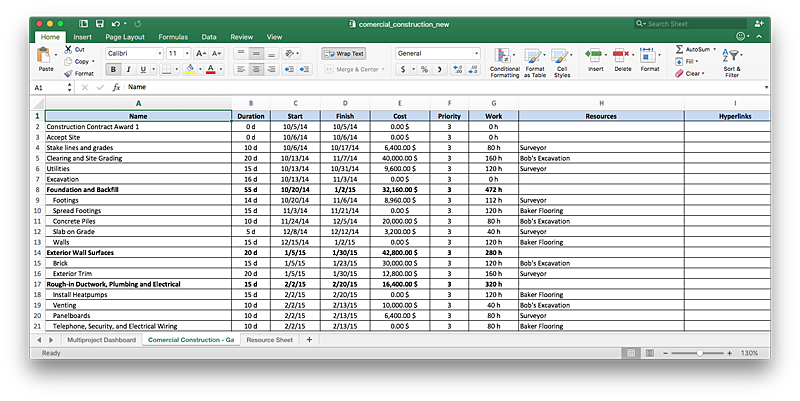
How to Export Project Data to MS Excel Worksheet
You can share your ConceptDraw PROJECT files with colleagues who use MS Excel®using the export capabilities of ConceptDraw PROJECT.HelpDesk
How to Generate ConceptDraw PROJECT Standard Reports on PC
The reporting capabilities of ConceptDraw PROJECT are really impressive. This section will help you find out what useful information can be obtained when using ConceptDraw PROJECT standard reports.Project —Task Trees and Dependencies
Users new to ConceptDraw PROJECT will find the Basic lessons an essential platform for familiarizing themselves with the program′s functions. This video lesson will teach you how to set up task trees and dependencies.HelpDesk
How to Create Multple Projects Schedule on Windows
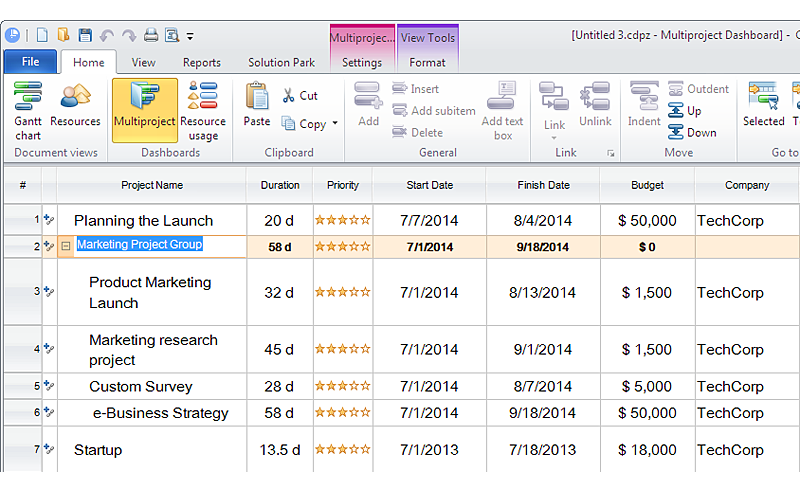
ConceptDraw PROJECT is simple project scheduling software, it allows grouping individual projects into a multiple project that can use a common resource pool and a synchronized task schedule. You can create a detailed schedule of your multiple project quickly and easy with ConceptDraw PROJECT. When considering project change requests, project manager can model their interaction by grouping or dividing into sub-projects. It include useful critical path scheduling software tools. Multiproject Dashboard enables planning and managing several projects simultaneously using the single resource pool for all projects. The Multiproject Dashboard helps you plan multiple projects while providing you with overall view.Construction Project Chart Examples
ConceptDraw PROJECT provides a set of construction Gantt chart examples. Project manager requires task tracking, and project examples best approach to start. Make your project applying one of our ready-made examples.HelpDesk
What Information can be Displayed in the Multiproject Dashboard View
What information can can contain the projects list
- Ms Project Dashboard Report
- PM Dashboards | Project management task status dashboard | How ...
- How To Create Project Report | Sales Dashboard Template | Project ...
- PM Dashboards | Status Dashboard | How To Create Project Report ...
- How To Create Project Report | How to Report on Project Milestones ...
- How To Create Project Report | | Project —Task Trees and ...
- Example Of Project Management Kpi Dashboard Report
- Project Report Charts
- How To Create Project Report | How to Generate ConceptDraw ...
- Gantt Chart Project Reports
- How To Create Project Report | How to Publish Project Reports on ...
- PM Dashboards | How to Report on Multiple Projects Status | PM ...
- PM Dashboards | Project — Working With Costs | KPI Dashboard ...
- How To Create Project Report | Project —Task Trees and ...
- How to Create Project Dashboard on Mac | How to Create Multiple ...
- Status Dashboard | PM Dashboards | How to Create Project ...
- PM Dashboards | How to Create Project Dashboard on Mac | Status ...
- How to Publish Project Reports on the Web Using ConceptDraw PRO
- How to Export Project Data to MS Excel Worksheet | How to Report ...
- Status Dashboard | PM Dashboards | How to Create Project ...
- ERD | Entity Relationship Diagrams, ERD Software for Mac and Win
- Flowchart | Basic Flowchart Symbols and Meaning
- Flowchart | Flowchart Design - Symbols, Shapes, Stencils and Icons
- Flowchart | Flow Chart Symbols
- Electrical | Electrical Drawing - Wiring and Circuits Schematics
- Flowchart | Common Flowchart Symbols
- Flowchart | Common Flowchart Symbols

