"A project plan, according to the Project Management Body of Knowledge, is: "...a formal, approved document used to guide both project execution and project control. The primary uses of the project plan are to document planning assumptions and decisions, facilitate communication among stakeholders, and document approved scope, cost, and schedule baselines. A project plan may be summarized or detailed." ...
The objective of a project plan is to define the approach to be used by the Project team to deliver the intended project management scope of the project.
At a minimum, a project plan answers basic questions about the project:
Why? - What is the problem or value proposition addressed by the project? Why is it being sponsored?
What? - What is the work that will be performed on the project? What are the major products/ deliverables?
Who? - Who will be involved and what will be their responsibilities within the project? How will they be organized?
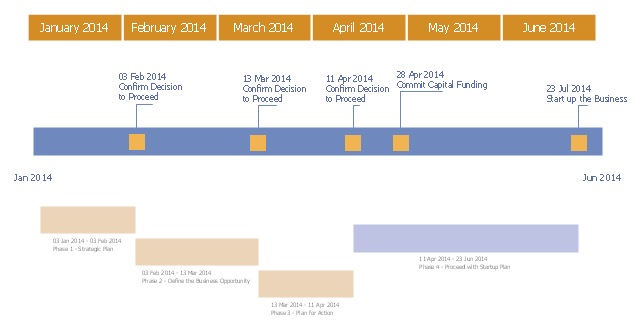
When? - What is the project timeline and when will particularly meaningful points, referred to as milestones, be complete?" [Project plan. Wikipedia]
The timeline diagram example "New business project plan" was created using the ConceptDraw PRO diagramming and vector drawing software extended with the Timeline Diagrams solution from the Management area of ConceptDraw Solution Park.
The objective of a project plan is to define the approach to be used by the Project team to deliver the intended project management scope of the project.
At a minimum, a project plan answers basic questions about the project:
Why? - What is the problem or value proposition addressed by the project? Why is it being sponsored?
What? - What is the work that will be performed on the project? What are the major products/ deliverables?
Who? - Who will be involved and what will be their responsibilities within the project? How will they be organized?
When? - What is the project timeline and when will particularly meaningful points, referred to as milestones, be complete?" [Project plan. Wikipedia]
The timeline diagram example "New business project plan" was created using the ConceptDraw PRO diagramming and vector drawing software extended with the Timeline Diagrams solution from the Management area of ConceptDraw Solution Park.
Project timeline
 Timeline Diagrams
Timeline Diagrams solution extends ConceptDraw DIAGRAM diagramming software with samples, templates and libraries of specially developed smart vector design elements of timeline bars, time intervals, milestones, events, today marker, legend, and many other elements with custom properties, helpful for professional drawing clear and intuitive Timeline Diagrams. Use it to design simple Timeline Diagrams and designate only the main project stages, or highly detailed Timeline Diagrams depicting all project tasks, subtasks, milestones, deadlines, responsible persons and other description information, ideal for applying in presentations, reports, education materials, and other documentation.
How to Make a Timeline

Timeline Examples

HelpDesk
How to Create a Timeline Diagram

Emergency Action Plan Template

Business diagrams & Org Charts with ConceptDraw DIAGRAM


Activity Network Diagram Method

This sample shows the PERT (Program Evaluation Review Technique) chart of the request on proposal. A request for proposal (RFP) is a request of the company or the organization to potential suppliers to submit the business proposals for service or goods that it is interested to purchase. The RFP is represented on the initial procurement stage and allows to define the risks and benefits.
ConceptDraw PROJECT Software Overview

Activity Network (PERT) Chart
 Chart *")
This diagram is constructed as part of the process in creating a schedule of corrective actions. The Activity Network Chart (PERT) shows the logical connections and consequence of tasks to be performed. It displays the time period for problem solving and the implementation of all activities through the critical path.
Examples of Flowcharts, Org Charts and More


Project Timeline

You need to make professional looking project timeline? Create it with ConceptDraw DIAGRAM! ConceptDraw DIAGRAM extended with Timeline Diagrams Solution from the Management Area is the best timeline diagrams software
EPC for Business Process Implementation

ConceptDraw DIAGRAM - software that reduces the time needed to create a business process model.
Timeline Diagrams

ConceptDraw DIAGRAM extended with Timeline Diagrams solution from the Management area of ConceptDraw Solution Park is a powerful software for fast and easy drawing useful and great-looking timeline diagrams.
CORRECTIVE ACTIONS PLANNING. PERT Chart

ConceptDraw Office suite is a software for corrective actions planning.

"The RFP presents preliminary requirements for the commodity or service, and may dictate to varying degrees the exact structure and format of the supplier's response. Effective RFPs typically reflect the strategy and short/ long-term business objectives, providing detailed insight upon which suppliers will be able to offer a matching perspective. ...
RFP:
(1) informs suppliers that an organization is looking to procure and encourages them to make their best effort.
(2) requires the company to specify what it proposes to purchase. If the requirements analysis has been prepared properly, it can be incorporated quite easily into the Request document.
(3) alerts suppliers that the selection process is competitive.
(4) allows for wide distribution and response.
(5) ensures that suppliers respond factually to the identified requirements.
(6) is generally expected to follow a structured evaluation and selection procedure, so that an organization can demonstrate impartiality - a crucial factor in public sector procurements." [Request for proposal. Wikipedia]
The project plan timeline diagram example "Request for proposal (RFP)" was created using the ConceptDraw PRO diagramming and vector drawing software extended with the Timeline Diagrams solution from the Management area of ConceptDraw Solution Park.
Project timeline
.png--diagram-flowchart-example.png)
How to Create Gantt Chart

Construction Project Chart Examples

HelpDesk
How to Create a Gantt Chart for Your Project

Gant Chart is a graphical representation of tasks as segments on a time scale. It helps plan or overlapping.
- Project Timeline | How to Make a Timeline | Timeline Diagrams ...
- How to Make a Timeline | Project timeline diagram - New business ...
- Project timeline diagram - New business project plan
- Project Timeline Examples
- Project plan timeline - Request for proposal (RFP) | Project Timeline ...
- Computer Hardware - Reseller Business Plan | | How To Plan and ...
- Timeline Diagrams | Timeline - Template | Project timeline diagram ...
- How to Create a Timeline Diagram | Project Timeline | How to Make ...
- Gantt charts for planning and scheduling projects | What is Gantt ...
- How To Create a PERT Chart | Gantt charts for planning and ...
- Computer Hardware - Reseller Business Plan | How to Identify ...
- How To Plan and Implement Projects Faster | ConceptDraw ...
- Timeline Diagrams | Computer Hardware - Reseller Business Plan ...
- Timeline Diagrams | How to Make a Timeline | How to Report Task's ...
- Business Process Mapping — How to Map a Work Process | How to ...
- Examples Of A Project Plan For A Business
- Timeline Examples | Business Process Mapping — How to Map a ...
- How to Identify Project Milestones | How to Create a Timeline ...
- Project timeline - Request for proposal plan | | Proposal Software ...
- Timeline diagram - Project schedule | Project plan timeline ...
- ERD | Entity Relationship Diagrams, ERD Software for Mac and Win
- Flowchart | Basic Flowchart Symbols and Meaning
- Flowchart | Flowchart Design - Symbols, Shapes, Stencils and Icons
- Flowchart | Flow Chart Symbols
- Electrical | Electrical Drawing - Wiring and Circuits Schematics
- Flowchart | Common Flowchart Symbols
- Flowchart | Common Flowchart Symbols