Timeline charts presents events and time periods on a chronological scale. They are used in project management to visualize project milestones and upper level phases, and show project progress.
"Within the framework of project management, a milestone is an event that receives special attention. It is often put at the end of a stage to mark the completion of a work package or phase. Milestones can be put before the end of a phase so that corrective actions can be taken, if problems arise, and the deliverable can be completed on time.
In addition to signaling the completion of a key deliverable, a milestone may also signify an important decision or the derivation of a critical piece of information, which outlines or affects the future of a project. In this sense, a milestone not only signifies distance traveled (key stages in a project) but also indicates direction of travel since key decisions made at milestones may alter the route through the project plan." [Milestone (project management). Wikipedia]
This timeline diagram example was created using the ConceptDraw PRO diagramming and vector drawing software extended with the Timeline Diagrams solution from the Management area of ConceptDraw Solution Park.
Timeline

Project Timeline

You need to make professional looking project timeline? Create it with ConceptDraw DIAGRAM! ConceptDraw DIAGRAM extended with Timeline Diagrams Solution from the Management Area is the best timeline diagrams software
 Timeline Diagrams
Timeline Diagrams solution extends ConceptDraw DIAGRAM diagramming software with samples, templates and libraries of specially developed smart vector design elements of timeline bars, time intervals, milestones, events, today marker, legend, and many other elements with custom properties, helpful for professional drawing clear and intuitive Timeline Diagrams. Use it to design simple Timeline Diagrams and designate only the main project stages, or highly detailed Timeline Diagrams depicting all project tasks, subtasks, milestones, deadlines, responsible persons and other description information, ideal for applying in presentations, reports, education materials, and other documentation.
The vector stencils library "Timelines and milestones" contains 24 shapes of time scales with start and finish dates, time interval bars with progress indication and brackets, milestone, event and today markers for drawing the timeline diagrams using the ConceptDraw PRO diagramming and vector drawing software.
"A timeline is a way of displaying a list of events in chronological order, sometimes described as a project artifact. It is typically a graphic design showing a long bar labelled with dates alongside itself and (usually) events labelled on points where they would have happened. ...
Another type of timeline is used for project management. In these cases, timelines are used to help team members to know what milestones need to be achieved and under what time schedule. For example, in the case of establishing a project timeline in the implementation phase of the life cycle of a computer system." [Timeline. Wikipedia]
The example "Design elements - Timelines solution" is included in the Timeline Diagrams solution from the Management area of ConceptDraw Solution Park.
Timeline and milestone symbols

How to Make a Timeline

 PM Planning
The PM Planning solution extends the functional abilities of ConceptDraw MINDMAP and ConceptDraw PROJECT software, allowing to automatically create the spreadsheets reflecting the tasks and project statuses for people who have different project roles. The reporting capabilities of this solution are represented by the possibility to generate a wide range of project reports that allow the project managers, senior management and other project participants to be informed on a project daily progress and monthly objectives: All Inclusive Report, All Visible Columns, Milestones with Notes and Objectives, Projects Goals, Projects Managers, Project Team, and Top Level Tasks. The PM Planning solution from ConceptDraw Solution Park is a strong project management and productivity tool which simplifies the process of reporting and lets one create a document with the desired report, includes the predesigned examples, extends and improves the planning capabilities for all team members, improves the project communication, helps to accurately plan, maintain, and finish projects on time, to track the work of project resources, to perform the analytical work and to make effective decisions.
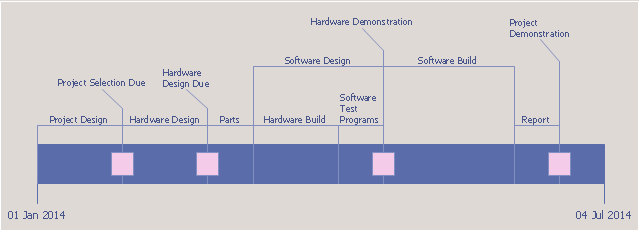
Timeline charts presents events and time periods on a chronological scale. They are used in project management to visualize project milestones and upper level phases, and show project progress.
"... timeline is used for project management. In these cases, timelines are used to help team members to know what milestones need to be achieved and under what time schedule. For example, in the case of establishing a project timeline in the implementation phase of the life cycle of a computer system." [Timeline. Wikipedia]
This project timeline diagram example was created using the ConceptDraw PRO diagramming and vector drawing software extended with the Timeline Diagrams solution from the Management area of ConceptDraw Solution Park.
Project timeline
HelpDesk
How to Create a Timeline Diagram

Swim Lanes Flowchart. Flowchart Examples

This sample shows the Swim Lanes Flowchart of Identification and logging.

How to Report Task's Execution with Gantt Chart

- Milestone Project Management Example
- Project Milestones Examples
- Milestone Business Plan Examples
- How to Identify Project Milestones | How to Create a Timeline ...
- Timeline Of Project Phases And Milestones
- Milestones Business Plan Examples
- Business Milestones Examples
- Project Mapping Tool Milestones
- Milestone Chart
- Project Milestone Diagram
- ERD | Entity Relationship Diagrams, ERD Software for Mac and Win
- Flowchart | Basic Flowchart Symbols and Meaning
- Flowchart | Flowchart Design - Symbols, Shapes, Stencils and Icons
- Flowchart | Flow Chart Symbols
- Electrical | Electrical Drawing - Wiring and Circuits Schematics
- Flowchart | Common Flowchart Symbols
- Flowchart | Common Flowchart Symbols