Business Process Reengineering Examples

Business Process Reengineering. Business Process Example

Quality Project Management with Mind Maps

Flowchart Programming Project. Flowchart Examples

The programming project flow chart example shows the logical process of execution.
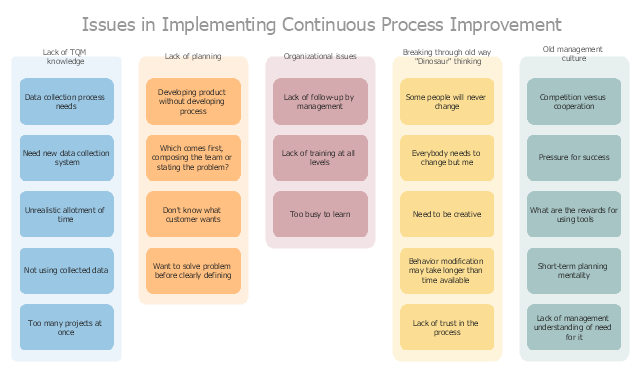
"A continual improvement process, also often called a continuous improvement process (abbreviated as CIP or CI), is an ongoing effort to improve products, services, or processes. These efforts can seek "incremental" improvement over time or "breakthrough" improvement all at once. Delivery (customer valued) processes are constantly evaluated and improved in the light of their efficiency, effectiveness and flexibility.
Some see CIPs as a meta-process for most management systems (such as business process management, quality management, project management, and program management)." [Continual improvement process. Wikipedia]
The affinity diagram example "Implementing continuous process improvement" was created using the ConceptDraw PRO diagramming and vector drawing software extended with the solution "Seven Management and Planning Tools" from the Management area of ConceptDraw Solution Park.
Affinity diagram
"A Guide to the Project Management Body of Knowledge - Fifth Edition provides guidelines for managing individual projects and defines project management related concepts. It also describes the project management life cycle and its related processes, as well as the project life cycle.
The Guide recognizes 47 processes that fall into five basic process groups and ten knowledge areas that are typical of almost all projects.
The five process groups are:
Initiating,
Planning,
Executing,
Monitoring and Controlling,
Closing.
The ten knowledge areas are:
Project Integration Management,
Project Scope Management,
Project Time Management,
Project Cost Management,
Project Quality Management,
Project Human Resource Management,
Project Communications Management,
Project Risk Management,
Project Procurement Management,
Project Stakeholders Management (added in 5th edition).
Each of the ten knowledge areas contains the processes that need to be accomplished within its discipline in order to achieve an effective project management program. Each of these processes also falls into one of the five basic process groups, creating a matrix structure such that every process can be related to one knowledge area and one process group." [A Guide to the Project Management Body of Knowledge. Wikipedia]
The flow chart example "Project management life cycle" was created using the ConceptDraw PRO diagramming and vector drawing software extended with the Flowcharts solution from the area "What is a Diagram" of ConceptDraw Solution Park.
Flowchart - Project management life cycle

Software Work Flow Process in Project Management with Diagram

This sample shows the Workflow Diagram that clearly illustrates stages a BPM consists of and relations between all parts of business. The Workflow Diagrams are used to represent the transferring of data during the work process, to study and analysis the working processes, and to optimize a workflow.
Project — Assigning Resources


How To Use Skype for Business


Project —Task Trees and Dependencies

BPR Diagram. Business Process Reengineering Example

Project — Working With Tasks

These videos provide a series of lessons that will enhance the understanding of all our users, from people just starting out with the software, through to expert users.
Process Flowchart


Flowchart of Products. Flowchart Examples

A Flowchart is a graphically representation of the process that step-by-step lead to the solution the problem. The geometric figures on the Flowchart represent the steps of the process and are connected with arrows that show the sequence of the actions. The Flowcharts are widely used in engineering, architecture, science, analytics, government, politics, business, marketing, manufacturing, administration, etc.
- Program Management Project Management
- Project Management And Program Management
- Project management life cycle - Flowchart | Basic Diagramming ...
- Programme Management Diagram
- It Program Management
- Project Management Program
- Program Management It
- Sample Of Business Management Project
- Software Program Management
- Software Work Flow Process in Project Management with Diagram ...
- Gantt chart examples | Gant Chart in Project Management | Business ...
- Communication Tool for Remote Project Management | How To ...
- Project Management Process Flow
- Conceptdraw.com: Mind Map Software, Drawing Tools | Project ...
- Dependencies Software Project Management Examples
- Project Management Structure Diagram
- Audit flowchart - Project management process | Software Work Flow ...
- Project Management Business Process
- Gant Chart in Project Management | Gantt chart examples | Process ...
- Business Process Reengineering Examples | BPR Diagram ...
- ERD | Entity Relationship Diagrams, ERD Software for Mac and Win
- Flowchart | Basic Flowchart Symbols and Meaning
- Flowchart | Flowchart Design - Symbols, Shapes, Stencils and Icons
- Flowchart | Flow Chart Symbols
- Electrical | Electrical Drawing - Wiring and Circuits Schematics
- Flowchart | Common Flowchart Symbols
- Flowchart | Common Flowchart Symbols