Flowchart Programming Project. Flowchart Examples
Flowcharts can be used in designing and documenting both simple and complex processes or programs and, similar to the other types of diagrams, they can help visualize what happens and so help understand some definite process, and, as a result, find flaws, bottlenecks and other features within it.Process Flowchart
ConceptDraw is Professional business process mapping software for making process flow diagram, workflow diagram, general flowcharts and technical illustrations for business documents. It is includes rich examples, templates, process flowchart symbols. ConceptDraw flowchart maker allows you to easier create a process flowchart. Use a variety of drawing tools, smart connectors, flowchart symbols and shape libraries to create flowcharts of complex processes, process flow diagrams, procedures and information exchange.Easy Flowchart Program and Standard Flowchart Symbols
Fast visualization of structured data is main capability of the ConceptDraw DIAGRAM. With numerous vector stencils and standard flowchart symbols from object libraries and the RapidDraw technology this program stands as the best professional flowchart software for drawing with type of flowchart symbols. ConceptDraw DIAGRAM also known as best flowchart maker.Program Evaluation and Review Technique (PERT) with ConceptDraw DIAGRAM
PERT Diagram is a more realistic approach of a project's time estimate analysis. After PERT chart was constructed user can discover the shortest possible duration for entire project timescale. The project timeline is the longest chain that might be taken with connected tasks on the PERT Diagram. Completion of serial tasks need to be accomplished in a presented order. At a project timeline can be independent tasks that not linked with main sequence they are called parallel tasks. PERT diagram is more suitable for Critical Path Analysis than Gantt chart for the reason that it undoubtedly better determine task dependencies. Project managers customarily utilize both methodologies.Circuits and Logic Diagram Software
ConceptDraw DIAGRAM provides Electrical Engineering solution from the Industrial Engineering Area of ConceptDraw Solution Park.Electrical Engineering solution helps you create quick and easy: Electrical schematics, Digital and analog logic designs, Circuit and wiring schematics and diagrams, Power systems diagrams, Maintenance and repair diagrams, Circuit board and amplifier diagrams, Integrated circuit schematics.
Venn Diagram Examples for Problem Solving. Venn Diagram as a Truth Table
Venn diagrams are illustrations used in the branch of mathematics known as set theory. They show the mathematical or logical relationship between different groups of things (sets). A Venn diagram shows all the possible logical relations between the sets.Basic Diagramming
ConceptDraw DIAGRAM with the specific tools you need to easily draw flowcharts, block diagrams, bar charts, histograms, pie charts, divided bar diagrams, line graphs, area charts, scatter plots, circular arrows diagrams, Venn diagrams, bubble diagrams, concept maps, electrical circuit diagrams, schematics,and others.Use Basic Diagramming solution to draw you own diagrams, charts and graphs for graphic communication, explanation of business and personal ideas and concepts, simple visual presentation of numerical data, complex structures, logical relations, step-by-step flows of actions or operations.
Activity on Node Network Diagramming Tool
Activity on Node Network Diagramming Tool - Activity Network and Project Evaluation and Review Technique, or PERT, charts are a way of documenting and analyzing the tasks in a project.This sample shows the Activity on node network diagramming method. It was created in ConceptDraw DIAGRAM diagramming and vector drawing software using the Seven Management and Planning Tools solution from the Management area of ConceptDraw Solution Park.
Technical Flow Chart
Flow chart is a diagrammatic representation of an algorithm and essential part of planning the system. Flow charts are widely used in technical analysis and programming for easy writing programs and explaining them to others. So, one of the most popular type of flow charts is Technical Flow Chart.Technical Flow Chart can be drawn by pencil on the paper, but it will be easier to use for designing a special software. ConceptDraw DIAGRAM diagramming and vector drawing software extended with Flowcharts Solution from the "Diagrams" Area of ConceptDraw Solution Park will be useful for this goal.
Electrical Symbols — Logic Gate Diagram
In electronics, a logic gate is an idealized or physical device implementing a Boolean function; that is, it performs a logical operation on one or more logical inputs, and produces a single logical output. Depending on the context, the term may refer to an ideal logic gate, one that has for instance zero rise time and unlimited fan-out, or it may refer to a non-ideal physical device
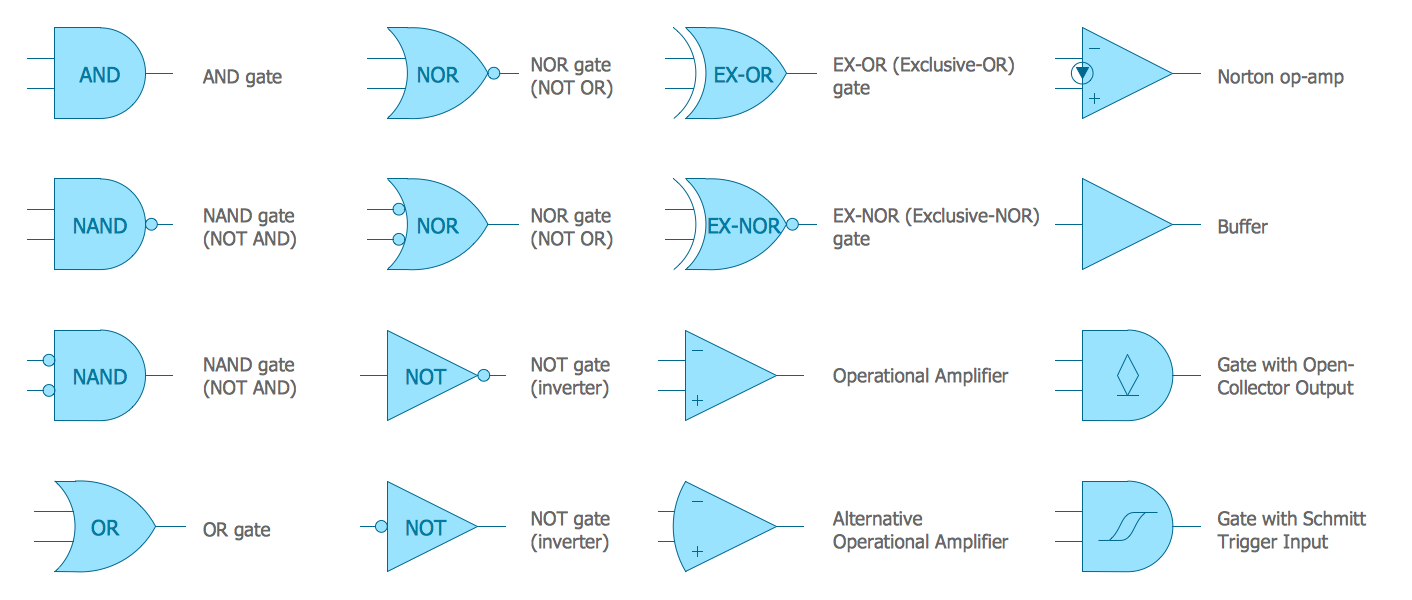
26 libraries of the Electrical Engineering Solution of ConceptDraw DIAGRAM make your electrical diagramming simple, efficient, and effective. You can simply and quickly drop the ready-to-use objects from libraries into your document to create the electrical diagram.
- Top 5 Android Flow Chart Apps | Program Logic And Write Algorithm ...
- Create Block Diagram | Logic Block Diagram Program
- Program Logic Diagram
- Modeling A Program Logic Using Flowchart
- Logical Steps Of A Program In Flowchart
- Logic Problem Flowchart
- Programming Block Diagram Symbols
- Network Diagram Software Logical Network Diagram | Software For ...
- Biology Drawing Software | Physics Diagrams | Chemistry Drawing ...
- Process Flowchart | Top 5 Android Flow Chart Apps | Flowchart ...
- ERD | Entity Relationship Diagrams, ERD Software for Mac and Win
- Flowchart | Basic Flowchart Symbols and Meaning
- Flowchart | Flowchart Design - Symbols, Shapes, Stencils and Icons
- Flowchart | Flow Chart Symbols
- Electrical | Electrical Drawing - Wiring and Circuits Schematics
- Flowchart | Common Flowchart Symbols