Activity Network Diagram Method

This sample shows the PERT (Program Evaluation Review Technique) chart of the request on proposal. A request for proposal (RFP) is a request of the company or the organization to potential suppliers to submit the business proposals for service or goods that it is interested to purchase. The RFP is represented on the initial procurement stage and allows to define the risks and benefits.
Purchasing Flowchart - Purchase Order. Flowchart Examples

The flow chart example shows the steps of purchasing business process.
Process Flowchart


Flow chart Example. Warehouse Flowchart

Standard warehousing process flow diagram and standard workflow diagram used for process identification for further evaluating effectiveness and profitability of overall business process. Use the ConceptDraw PRO diagramming and vector drawing software extended with the Flowcharts solution from the Diagrams area of ConceptDraw Solution Park to design your own workflow diagrams, process flow diagram and flow charts. Need to use Process Flow Diagram for designing Warehouse packages flow.

Basic Flowchart Symbols and Meaning


Cross-Functional Process Map Template

Use templates with process maps, diagrams, charts to get the drawing in minutes.
Influence Diagram

Influence diagram represents the directed acyclic graph with three types of nodes and three types of arcs that connect the nodes. Decision node is drawn as a rectangle, Uncertainty node is drawn as an oval, Value node is drawn as an octagon.
Product Proposal Template

This template shows the Product Proposal Diagram on that is displayed the sequence of the product planning steps. This diagram is convenient, visual and clear.
Steps in the Accounting Process

9 steps in the accounting process: Analysis of Business Transactions, Make Journal Entries, Post to Ledger Accounts, Prepare Trial Balance, Make Adjusting Entries, Adjusted Trial Balance, Prepare Financial Statements, Close Accounts, Post-Closing Trial Balance.
Cross-Functional Flowchart

Use cross-functional flowcharts to show the relationship between a business process and the functional units (such as departments) responsible for that process. To create it use the best flowchart maker of ConceptDraw PRO.

SWOT Matrix Template

Affinity Diagram

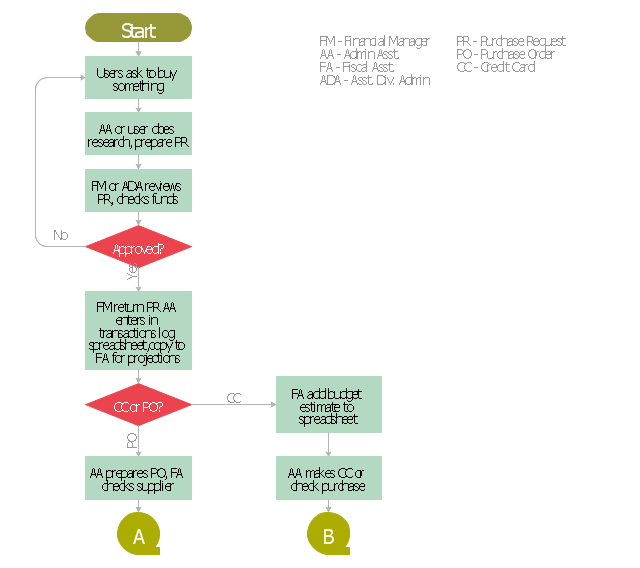
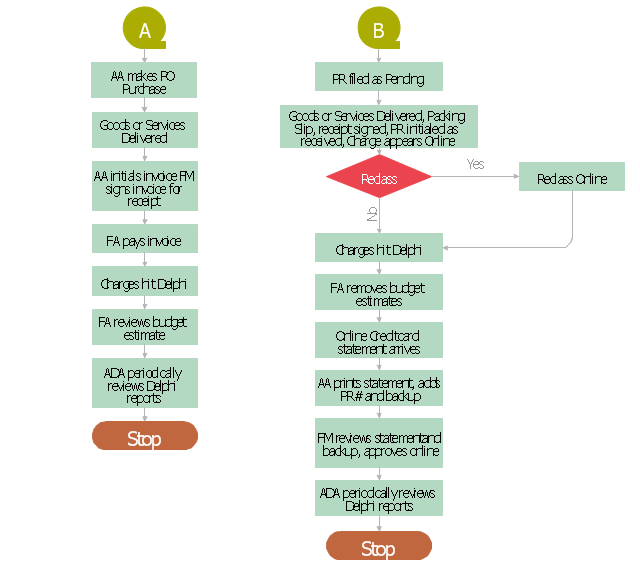
 Accounting Flowcharts
Accounting Flowcharts solution extends ConceptDraw PRO software with templates, samples and library of vector stencils for drawing the accounting flow charts.
This accounting flowchart example was created on the base of the figure illustrating webpage "CHAPTER 4. CONDUCTING AN ADMINISTRATIVE REVIEW" from the website of the Federal Highway Administration (FHWA) of the United States Department of Transportation. [fhwa.dot.gov/ legsregs/ directives/ orders/ toolkita2.htm]
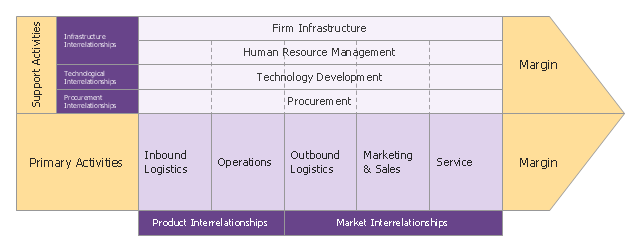
"Business process mapping refers to activities involved in defining what a business entity does, who is responsible, to what standard a business process should be completed, and how the success of a business process can be determined.
The main purpose behind business process mapping is to assist organizations in becoming more efficient. A clear and detailed business process map or diagram allows outside firms to come in and look at whether or not improvements can be made to the current process.
Business process mapping takes a specific objective and helps to measure and compare that objective alongside the entire organization's objectives to make sure that all processes are aligned with the company's values and capabilities." [Business process mapping. Wikipedia]
The business process map of procurement process example "Procurement process mapping" was created using the ConceptDraw PRO software extended with the Accounting Flowcharts solution from the Finance and Accounting area of ConceptDraw Solution Park.
Procurement Process Mapping
Procurement Mapping Process A, B
- Procurement Diagram Templates
- Risk Positioning Diagram | SWOT Matrix Template | Diagram Of ...
- Procurement Process Flow Chart Template
- Procurement Flow Chart Template
- Procurement Diagram
- Procurement Process Swimlane Flow
- Value stream map parts | Cross-Functional Process Map Template ...
- Procurement process mapping | Purchasing Flowchart - Purchase ...
- Activity Network Diagram Method | Flow chart Example. Warehouse ...
- Procurement process mapping | Payroll process - Swim lane ...
- Purchasing Flowchart - Purchase Order. Flowchart Examples | Steps ...
- Government Procurement Process Flow Chart
- Cross-Functional Process Map Template | Purchasing Flowchart ...
- Procurement Timeline Template
- It Procurement Process Flow Chart
- Root Cause Analysis | Influence Diagram | Affinity Diagram ...
- Procurement Cycle Diagrams
- Procurement process mapping
- Flow chart Example. Warehouse Flowchart | Affinity Diagram | Cross ...
- Process Flowchart | Payroll process - Swim lane process mapping ...
- ERD | Entity Relationship Diagrams, ERD Software for Mac and Win
- Flowchart | Basic Flowchart Symbols and Meaning
- Flowchart | Flowchart Design - Symbols, Shapes, Stencils and Icons
- Flowchart | Flow Chart Symbols
- Electrical | Electrical Drawing - Wiring and Circuits Schematics
- Flowchart | Common Flowchart Symbols
- Flowchart | Common Flowchart Symbols