Cross-Functional Flowchart

Use cross-functional flowcharts to show the relationship between a business process and the functional units (such as departments) responsible for that process. To create it use the best flowchart maker of ConceptDraw PRO.

Scrum process work items and workflow

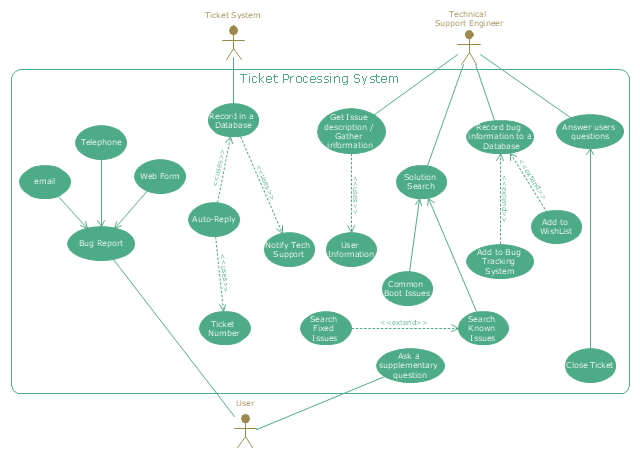
"An example scenario is presented to demonstrate how a common issue tracking system would work:
(1) A customer service technician receives a telephone call, email, or other communication from a customer about a problem. Some applications provide built-in messaging system and automatic error reporting from exception handling blocks.
(2) The technician verifies that the problem is real, and not just perceived. The technician will also ensure that enough information about the problem is obtained from the customer. This information generally includes the environment of the customer, when and how the issue occurs, and all other relevant circumstances.
(3) The technician creates the issue in the system, entering all relevant data, as provided by the customer.
(4) As work is done on that issue, the system is updated with new data by the technician. Any attempt at fixing the problem should be noted in the issue system. Ticket status most likely will be changed from open to pending.
(5) After the issue has been fully addressed, it is marked as resolved in the issue tracking system.
If the problem is not fully resolved, the ticket will be reopened once the technician receives new information from the customer. A Run Book Automation process that implements best practices for these workflows and increases IT personnel effectiveness is becoming very common." [Issue tracking system. Wikipedia]
The UML use case diagram example "Ticket processing system" was created using the ConceptDraw PRO diagramming and vector drawing software extended with the Rapid UML solution from the Software Development area of ConceptDraw Solution Park.
UML use case diagram
Audit Flowchart Symbols

Audit Flowchart Symbols - It’s efficiently to use the colors creating the audit flowcharts to make them bright, visual, attractive and successful. The best flowchart maker use ConceptDraw PRO features of RapidDraw technique.
Audit Process Flowchart. Audit Flowchart

Gantt Chart Software

ConceptDraw PROJECT provides wide capabilities of importing and exporting in various formats: Microsoft Project, ConceptDraw MINDMAP, Mindjet MindManager, PDF file.
Auditing Process. Audit Planning Process

Basic Audit Flowchart. Flowchart Examples

The Audit Flowcharts are widely used in the financial management, accounting, money management and in many others fields.
Example of Flowchart Diagram

Flowchart Programming Project. Flowchart Examples

The programming project flow chart example shows the logical process of execution.
Example of DFD for Online Store (Data Flow Diagram) DFD Example

Example of DFD for Online Store shows the Data Flow Diagram for online store and interactions between the Visitors, Customers and Sellers, as well as Website Information and User databases.

Software Flow Chart

Definition of flowchart - a diagram that shows step-by-step progression through a procedure or system especially using connecting lines and a set of conventional symbols.
All the icons, symbols and connectors needed for creating standardized notation flowcharts are contained within Software Flow Chart.
Cross Functional Flowchart Shapes

ConceptDraw Template library has more than enough versatility to draw any type of diagram with any degree of complexity.
You will get a cross-functional flowchart with basic shapes which can be drawn in minutes, as the result.
- Car Software Tracking Business Process Diagrams
- Team Task Tracking Software
- Issue Tracking System
- Business Process Modeling Software for Mac | BPM Software ...
- Free Project Tracking Software
- Business Process Modeling Software for Mac | BPM Software ...
- PM Dashboards | Process Flowchart | PM Meetings | Project ...
- Software Project Tracking
- Project Tracking Software
- Trouble ticket system - BPMN 2.0 diagram | Business Process ...
- Business Process Modeling Software for Mac | BPM Software | The ...
- Process Flowchart | Building Drawing Software for Design Office ...
- Track Project Management Software
- BPMN 2.0 | Trouble ticket system - BPMN 2.0 diagram | Design ...
- Basic Flowchart Symbols and Meaning | Audit Flowchart Symbols ...
- UML activity diagram - Ticket processing system | Cross-Functional ...
- UML use case diagram - Ticket processing system | UML activity ...
- Data Flow Diagram For Object Tracking
- BPMN 2.0 | Business Process Modeling Software for Mac | Logistics ...
- How to Create SWOT Analysis Template Using ConceptDraw PRO ...
- ERD | Entity Relationship Diagrams, ERD Software for Mac and Win
- Flowchart | Basic Flowchart Symbols and Meaning
- Flowchart | Flowchart Design - Symbols, Shapes, Stencils and Icons
- Flowchart | Flow Chart Symbols
- Electrical | Electrical Drawing - Wiring and Circuits Schematics
- Flowchart | Common Flowchart Symbols
- Flowchart | Common Flowchart Symbols