Identifying Quality Management System

Human Resources
Recruitment

The recruitment process often requires design and use of various HR flowcharts, diagrams, attractive illustrations. Never before their creation wasn’t so easy as now with HR Flowcharts Solution from the Management Area of ConceptDraw Solution Park.
HR infographics "Electronic human resources (E-HR)" was redesigned from the Wikimedia Commons file: Ehr diagram.jpg. [commons.wikimedia.org/ wiki/ File:Ehr_ diagram.jpg]
This file is licensed under the Creative Commons Attribution-Share Alike 3.0 Unported license. [creativecommons.org/ licenses/ by-sa/ 3.0/ ]
"E-HR is a function of HR that is concerned with the use, management, and regulation of electronic information and processes within an organization.
E-HR is different from E-HRM (Electronic Human Resource Management) and HRIS (Human Resource Information System) which are uses of technology. More specifically, E-HRM is a system that allows management and employees access to human resource related information and services through an organization's intranet or web portal. HRIS refers to enterprise resource planning software that streamlines human resource functions such as payroll.
In contrast, E-HR is a function of human resources that requires cross-functional knowledge and collaboration between multiple departments, most notably human resources and information technology." [Electronic human resources. Wikipedia]
The HR infographics example "Electronic human resources (E-HR)" was created using the ConceptDraw PRO diagramming and vector drawing software extended with the HR Flowcharts solution from the Management area of ConceptDraw Solution Park.
HR infographics
.png--diagram-flowchart-example.png)
Used Solutions
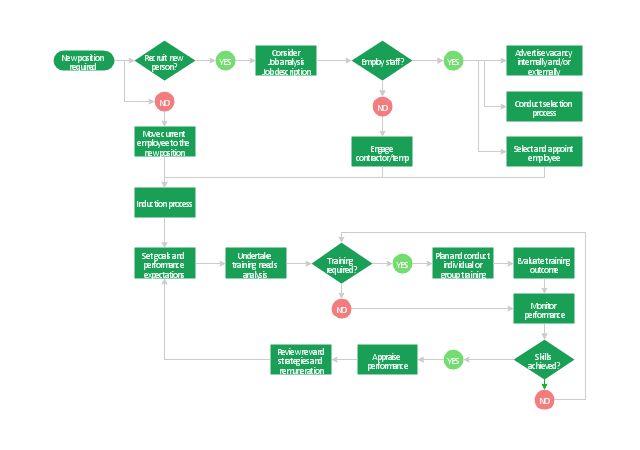
"Human resource management (HRM, or simply HR) is the management process of an organization's workforce, or human resources. It is responsible for the attraction, selection, training, assessment, and rewarding of employees, while also overseeing organizational leadership and culture and ensuring compliance with employment and labor laws. In circumstances where employees desire and are legally authorized to hold a collective bargaining agreement, HR will also serve as the company's primary liaison with the employees' representatives (usually a trades union).
HR is a product of the human relations movement of the early 20th century, when researchers began documenting ways of creating business value through the strategic management of the workforce. The function was initially dominated by transactional work, such as payroll and benefits administration, but due to globalization, company consolidation, technological advancement, and further research, HR now focuses on strategic initiatives like mergers and acquisitions, talent management, succession planning, industrial and labor relations, and diversity and inclusion." [Human resource management. Wikipedia]
The flow chart example "HR management process" was created using the ConceptDraw PRO diagramming and vector drawing software extended with the Flowcharts solution from the area "What is a Diagram" of ConceptDraw Solution Park.
Flowchart - HR management process
Human Resource Management

Best Value — Total Quality Management
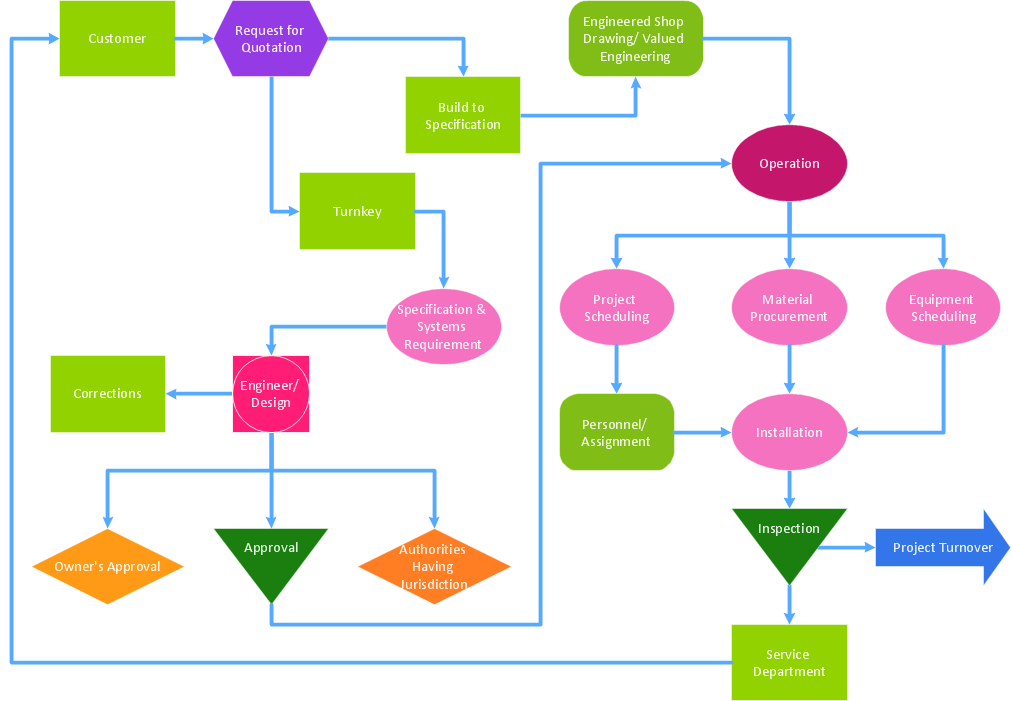
The vector stencils library "Workflow diagrams" contains 54 symbol icons of workflow diagrams.
Use these clipart to represent information flow, automation of business processes, business process re-engineering, accounting, management, and human resources tasks in industry, business, and manufacturing.
"The term workflow is more commonly used in particular industries, such as printing and professional domains, where it may have particular specialized meanings.
(1) Processes: A process is a more general notion than workflow and can apply to physical or biological processes, for instance; whereas a workflow is typically a process or collection of processes described in the context of work, such as all processes occurring in a machine shop.
(2) Planning and scheduling: A plan is a description of the logically necessary, partially ordered set of activities required to accomplish a specific goal given certain starting conditions. A plan, when augmented with a schedule and resource allocation calculations, completely defines a particular instance of systematic processing in pursuit of a goal. A workflow may be viewed as an (often optimal or near-optimal) realization of the mechanisms required to execute the same plan repeatedly.
(3) Flow control is a control concept applied to workflows, to distinguish from static control of buffers of material or orders, to mean a more dynamic control of flow speed and flow volumes in motion and in process. Such orientation to dynamic aspects is the basic foundation to prepare for more advanced job shop controls, such as just-in-time or just-in-sequence.
(4) In-transit visibility is a monitoring concept that applies to transported material as well as to work in process or work in progress, i.e., workflows." [Workflow. Wikipedia]
The example "Workflow diagram - Business" was drawn using the ConceptDraw PRO diagramming and vector drawing software extended with the Workflow Diagrams solution from the Business Processes area of ConceptDraw Solution Park.
Business - Work flow chart

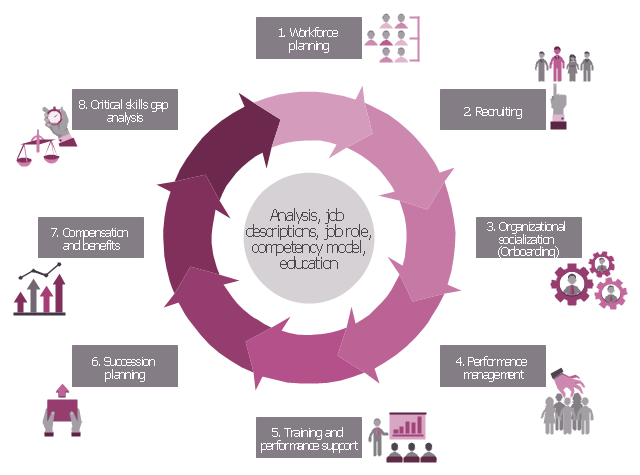
HR infographics "Talent management process" was redesigned from the Wikimedia Commons file: Model_ TM.jpg. [commons.wikimedia.org/ wiki/ File:Model_ TM.jpg]
"Talent management refers to the anticipation of required human capital for an organization and the planning to meet those needs. ...
Talent management is the science of using strategic human resource planning to improve business value and to make it possible for companies and organizations to reach their goals. Everything done to recruit, retain, develop, reward and make people perform forms a part of talent management as well as strategic workforce planning. A talent-management strategy needs to link to business strategy to make sense." [Talent management. Wikipedia]
The HR infographics example "Talent management process" was created using the ConceptDraw PRO diagramming and vector drawing software extended with the HR Flowcharts solution from the Management area of ConceptDraw Solution Park.
HR infographics
Account Flowchart Stockbridge System. Flowchart Examples

This is a flowchart of a data processing system combining manual and computerized processing to handle accounts receivable, billing, and general ledger.
Stakeholder Onion Diagrams

Design fast and easy Stakeholder Onion Diagrams of any complexity in ConceptDraw DIAGRAM diagramming and vector drawing software using the powerful tools of Stakeholder Onion Diagrams Solution from the Management Area of ConceptDraw Solution Park.
Material Requisition Flowchart. Flowchart Examples

The flowchart example shows the material requisition business process.
Column Chart Template

Property Management Examples

This sample shows the Property Management matrix, the ideas are ordered in regards to importance and frequency. This matrix gives the ability to turn the theory into quantifiable data.
Flow Diagram
ConceptDraw DIAGRAM diagramming and vector drawing software extended with Flowcharts Solution from the "Diagrams" Area of ConceptDraw Solution Park is a perfect powerful tool for extremely easy designing professional looking Flow Diagram.
- Process Of Human Resources Planning Wikipedia With Diagram
- Human Resource Planning Process Wikipedia
- Human Resource Planning Diagram
- Human Resources Planning Process Diagram
- Designing Hrm Wiki
- Use Illustrations To Discuss The Human Resource Planning Process
- Cross-Functional Flowcharts | Electronic human resources (E- HR ...
- Human Resource Wiki
- Human Resource Planning Process Diagram
- Human Resources | Electronic human resources (E- HR ) | Human ...
- Talent management process | HR Flowcharts | Human Resources ...
- Human Resource Development | Electronic human resources (E- HR ...
- Diagram Of Human Resouce Planning
- Best Human Resource Planning Process Infographic
- Human Resource Planning Process
- Hr Planning Flow Diagram
- Human Resource Development | Human Resources | Human ...
- Green Hrm Wikipedia
- Human Resource Functions With Diagram
- HR management process - Flowchart | Components of competency ...
- ERD | Entity Relationship Diagrams, ERD Software for Mac and Win
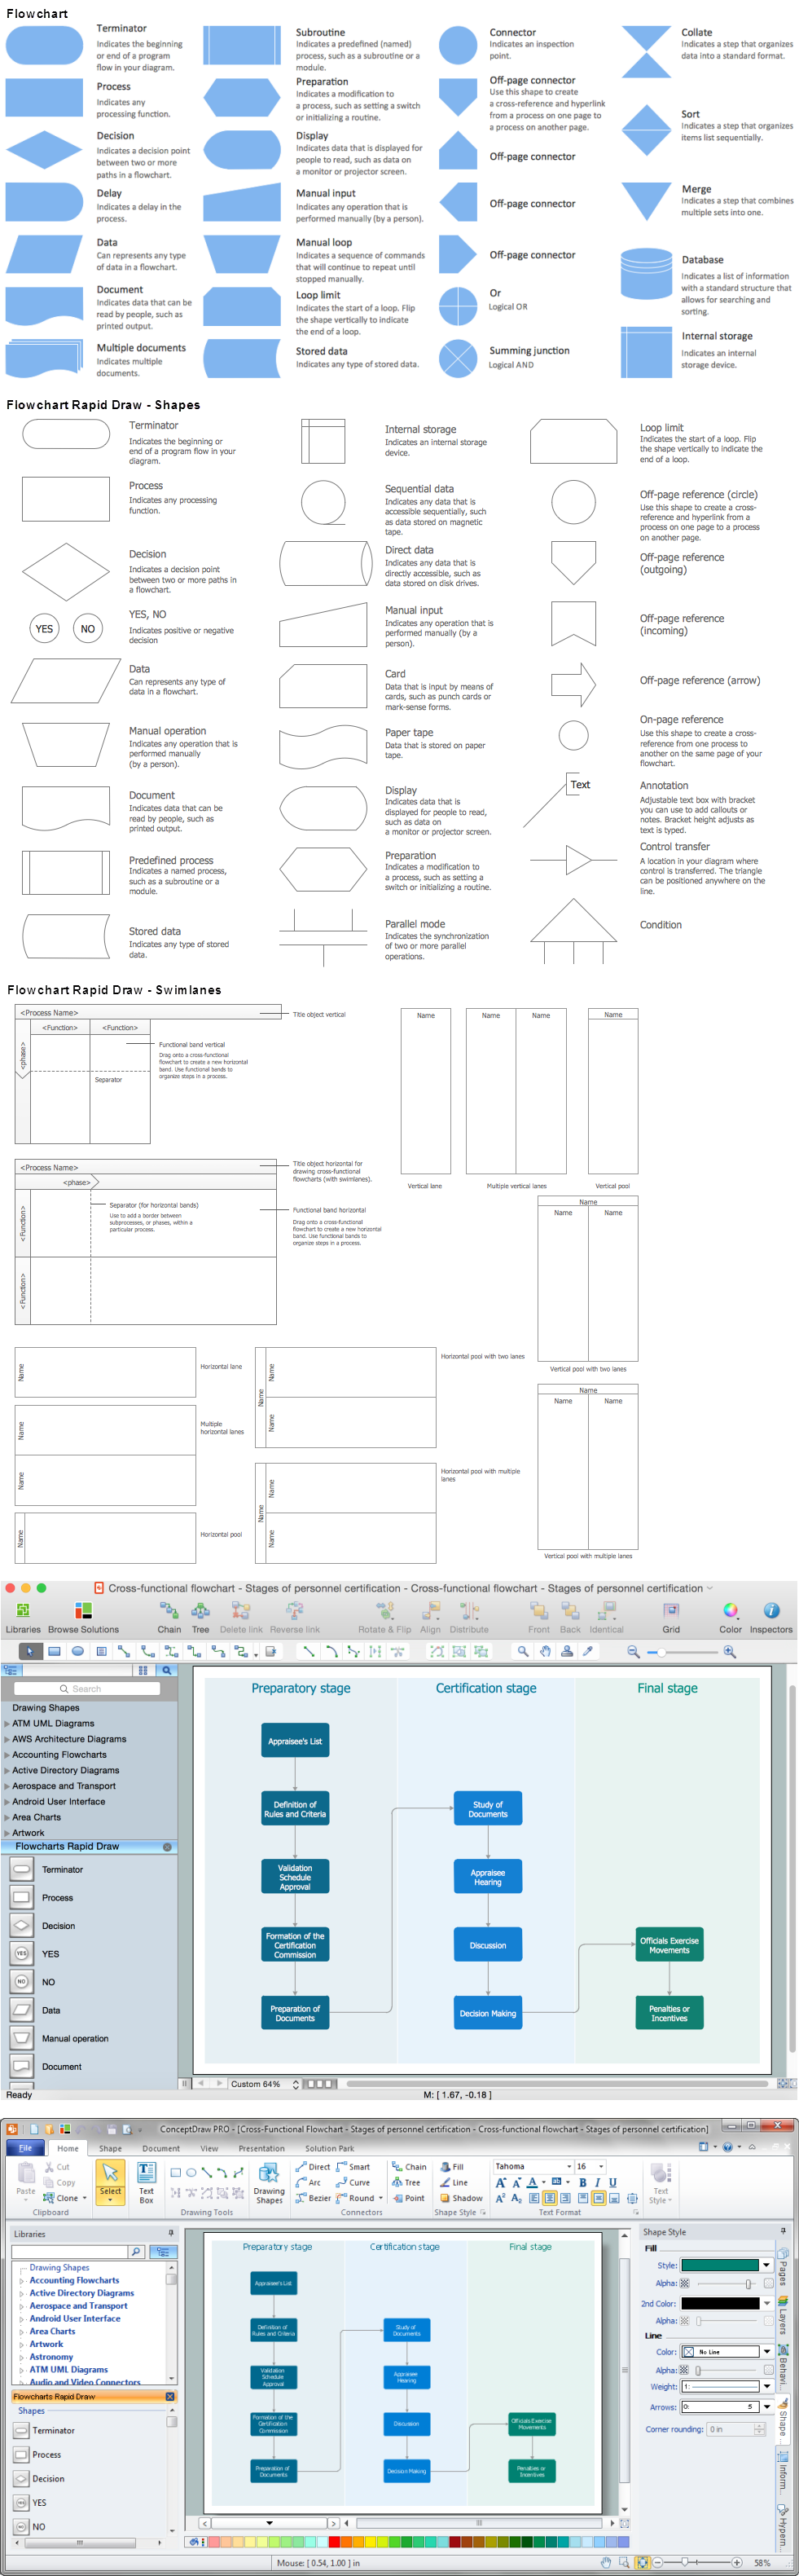
- Flowchart | Basic Flowchart Symbols and Meaning
- Flowchart | Flowchart Design - Symbols, Shapes, Stencils and Icons
- Flowchart | Flow Chart Symbols
- Electrical | Electrical Drawing - Wiring and Circuits Schematics
- Flowchart | Common Flowchart Symbols
- Flowchart | Common Flowchart Symbols