Process Flowchart
ConceptDraw is Professional business process mapping software for making process flow diagram, workflow diagram, general flowcharts and technical illustrations for business documents. It is includes rich examples, templates, process flowchart symbols. ConceptDraw flowchart maker allows you to easier create a process flowchart. Use a variety of drawing tools, smart connectors, flowchart symbols and shape libraries to create flowcharts of complex processes, process flow diagrams, procedures and information exchange.Work Order Process Flowchart. Business Process Mapping Examples
Create your own cross-functional flow charts of order processing steps using variety of vector objects from the libraries of Business Process Mapping Solution for ConceptDraw DIAGRAM Business Mapping Software and also collection of Business Process Maps, Flowcharts, Swim Lanes Diagrams and SIPOC Diagrams, and template from ConceptDraw STORE to create your own professional looking diagrams
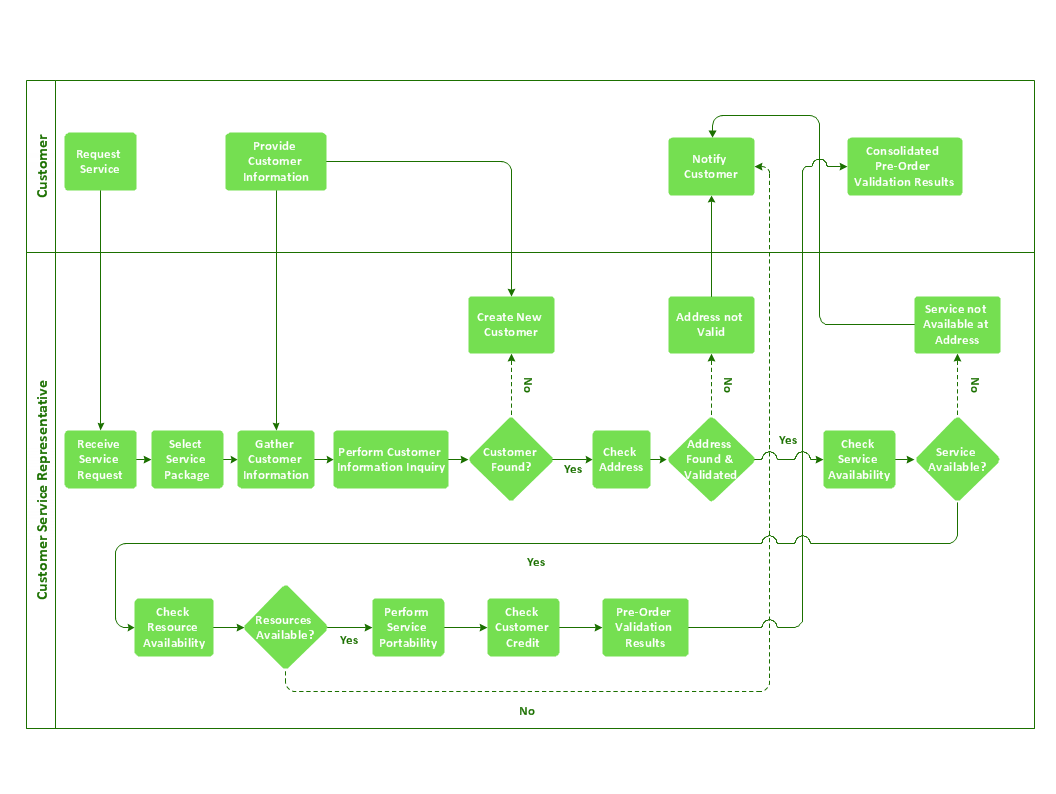
The cross-functional flow chart example shows business process mapping of the real property work order.
Cross-Functional Flowchart
Cross-Functional Flowchart - to draw cross functional process maps is by starting with a cross-functional flowchart samples and templates. Easy to draw sample cross functional Process Flow Diagrams. Using a Cross-Functional flowchart is a clear way of showing each team member’s responsibilities and how processes get shared or transferred between different teams and departments.Use cross-functional flowcharts to show the relationship between a business process and the functional units (such as departments) responsible for that process. To create it use the best flowchart maker of ConceptDraw DIAGRAM.
Value Stream Mapping
Value stream mapping solution extends ConceptDraw DIAGRAM software with templates, samples and vector stencils for drawing the Value Stream Maps (VSM) in lean manufacturing practice.
Types of Flowcharts
A Flowchart is a graphically representation of the process, algorithm or the step-by-step solution of the problem. There are ten types of Flowcharts. Using the Flowcharts solution from the Diagrams area of ConceptDraw Solution Park you can easy and quickly design the Flowchart of any of these types.Business Process Flowchart
Cross-functional (deployment) flowcharts visualize what functional units (people, departments or functional areas) are responsible for the business process operations.The flowcharts are divided into rows/columns of functional units. Blocks of various shapes represent the process steps, and are placed in rows/columns of the responsible functional units.
Competitor Analysis
Competitor analysis is a first and obligatory step in elaboration the proper corporate marketing strategy and creating sustainable competitive advantage. Use powerful opportunities of numerous solutions from ConceptDraw Solution Park for designing illustrative diagrams, charts, matrices which are necessary for effective competitor analysis.Fishbone Diagram Example
Fishbone Diagram, also referred as Cause and Effect diagram or Ishikawa diagram, is a fault finding and problem solving tool. Construction of Ishikawa diagrams is quite complicated process and has a number of features.Fishbone Diagrams solution included to ConceptDraw Solution Park contains powerful drawing tools and a lot of examples, samples and templates. Each Fishbone diagram example is carefully thought-out by experts and is perfect source of inspiration for you.
Flowchart Symbols Accounting. Activity-based costing (ABC) flowchart
This flow chart example represent activity-based costing flowchart (ABC flowchart): resource-catagories, resource cost drivers, activities, activity cost drivers, cost objects, direct materials, direct labour. This sort of accounting flowcharts intended to explain how costs distributed between company units and departments. There is only way to clearly explain activity-based cost distribution - create cost diagram demonstrating cost distribution relations and logics. ConceptDraw DIAGRAM is special software with accounting flowchart symbols and flowchart stencils for effective drawing activity-based cost flowcharts (ABC-flowcharts).Total Quality Management Value
The Total Quality Management Diagram solution helps you and your organization visualize business and industrial processes. Create Total Quality Management diagrams for business process with ConceptDraw software.- Service Industry Process Flow Chart
- Process Flowchart | Copying Service Process Flowchart. Flowchart ...
- Process Map For Service Industry
- Service Process Mapping Project In Automobile Industry
- Fishbone Diagram Example For Service Industry
- Audit Flowcharts | Flowchart Of Service Industry
- Process Flowchart | Types of Flowchart - Overview | Financial Trade ...
- Process Flowchart | Taxi Service Data Flow Diagram DFD Example ...
- Cross Functional Flowchart for Business Process Mapping | Service ...
- Logistics Flow Charts | Business Process Mapping | Event-driven ...
- ERD | Entity Relationship Diagrams, ERD Software for Mac and Win
- Flowchart | Basic Flowchart Symbols and Meaning
- Flowchart | Flowchart Design - Symbols, Shapes, Stencils and Icons
- Flowchart | Flow Chart Symbols
- Electrical | Electrical Drawing - Wiring and Circuits Schematics
- Flowchart | Common Flowchart Symbols