UML Use Case Diagram Example. Social Networking Sites Project

This sample shows the Facebook Socio-health system and is used at the projection and creating of the social networking sites.
Business Process Flow Diagram

ConceptDraw DIAGRAM extended with Business Process Workflow Diagrams solution from the Business Processes area of ConceptDraw Solution Park is a powerful software which lets easy design Business Process Flow Diagram of any complexity.
BPR Diagram. Business Process Reengineering Example

Example of DFD for Online Store (Data Flow Diagram)

Example of DFD for Online Store shows the Data Flow Diagram for online store and interactions between the Visitors, Customers and Sellers, as well as Website Information and User databases.

Pyramid Diagram

Fishbone Diagram Problem Solving

To design easily the Fishbone diagram, you can use a special ConceptDraw DIAGRAM vector graphic and diagramming software which contains the powerful tools for Fishbone diagram problem solving offered by Fishbone Diagrams solution for the Management area of ConceptDraw Solution Park.
EPC (Event-driven Process Chain) Flowcharts
Event-Driven Process Сhain Diagrams for improvement throughout an organisation.
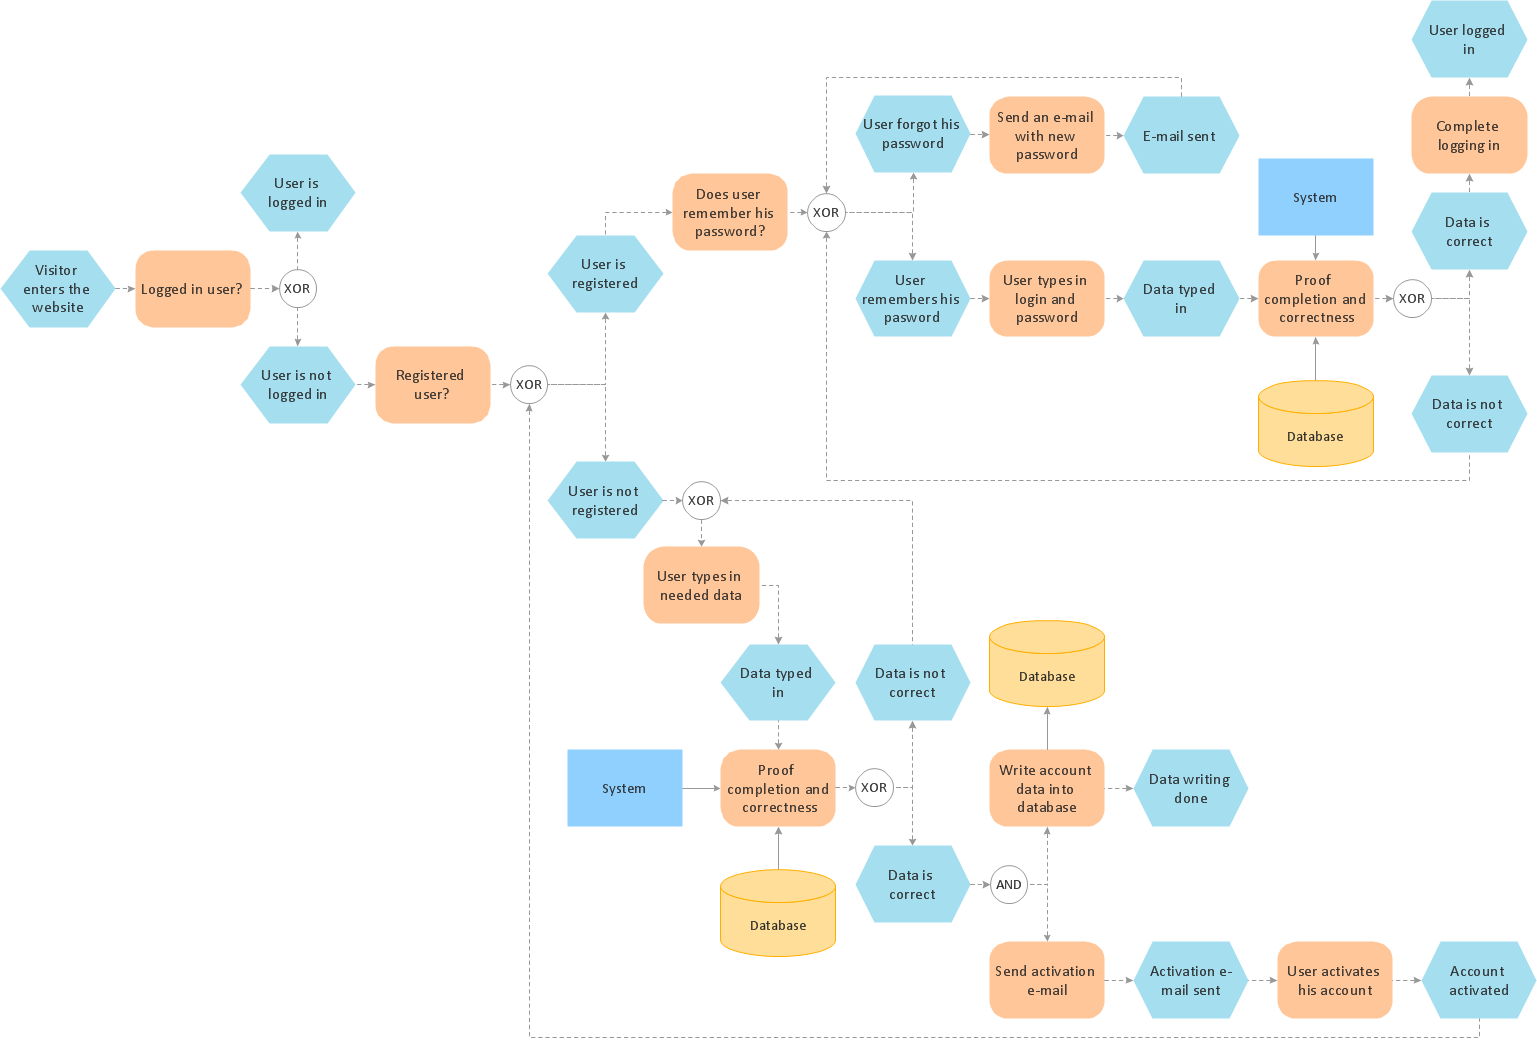
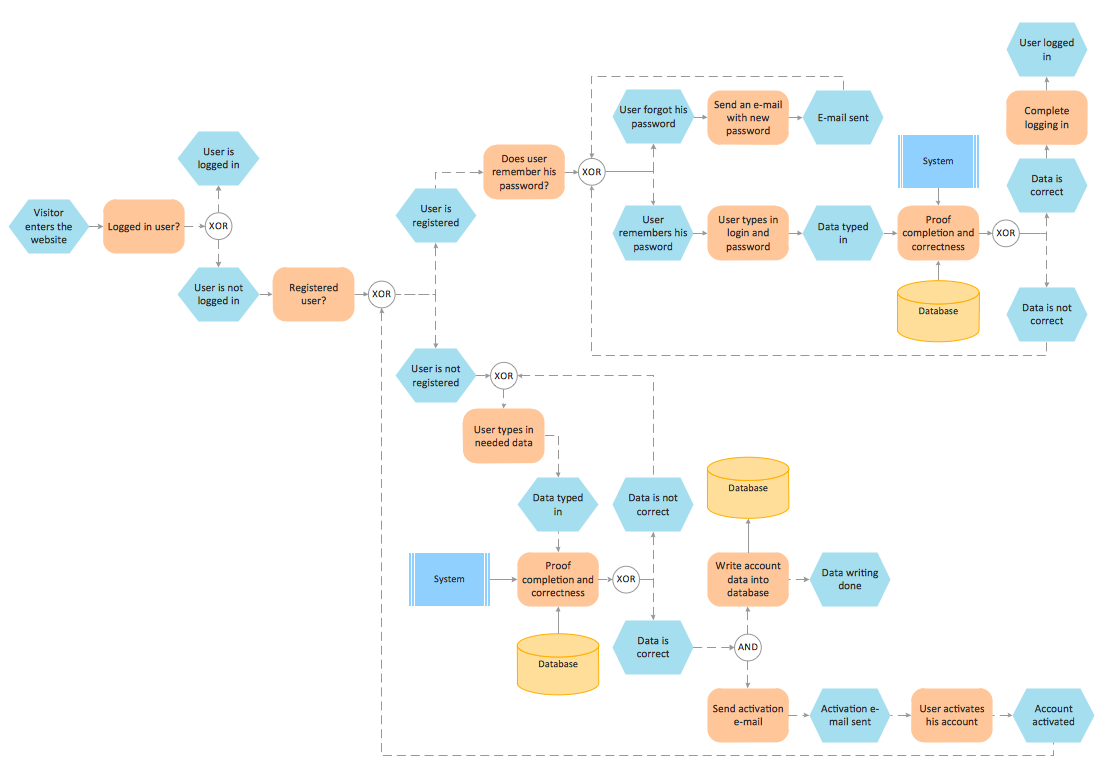
Business Process Workflow Diagram

The workflows on the Business Process Workflow Diagram are represented using the set of common symbols which let easy illustrate business processes and process flows, depict the start, all major steps and end of the process, what data are used by the process, how the data flow through the business areas within scope of our project, how the tasks are executed and by who, and how workers interact with each other.

 Business Process Workflow Diagrams
The Business Process Workflow Diagrams solution enhances the ConceptDraw DIAGRAM functionality with predesigned examples, samples and a numerous collection of predesigned vector objects of workflow chart elements, icons, arrows, connectors, and varied wor
Formalization and Verification of Event-driven Process chain
ConceptDraw DIAGRAM - software that reduces the time needed to create a business process model.
- Data Flow Diagram Of E Commerce Website
- E Commerce Website Data Flow Diagram
- E Commerce Process Flow
- Flow chart Example. Warehouse Flowchart | Example of DFD for ...
- Business Process Diagrams | Business Process Workflow Diagrams ...
- Business Process Diagrams | Office Layout Plans | E Commerce ...
- Business Process Mapping | Business Process Diagrams | Business ...
- Business Process Workflow Diagrams | Business Process Mapping ...
- Process Flow Diagram For E Commerce
- Process Flow Diagram For Ecommerce
- ERD | Entity Relationship Diagrams, ERD Software for Mac and Win
- Flowchart | Basic Flowchart Symbols and Meaning
- Flowchart | Flowchart Design - Symbols, Shapes, Stencils and Icons
- Flowchart | Flow Chart Symbols
- Electrical | Electrical Drawing - Wiring and Circuits Schematics
- Flowchart | Common Flowchart Symbols
- Flowchart | Common Flowchart Symbols